. 2019 Apr;30(4):546-562.
doi: 10.1681/ASN.2018060599. Epub 2019 Mar 11.

LRG1 Promotes Diabetic Kidney Disease Progression by Enhancing TGF- β-Induced Angiogenesis

Affiliations

LRG1 Promotes Diabetic Kidney Disease Progression by Enhancing TGF- β-Induced Angiogenesis

Quan Hong et al. J Am Soc Nephrol. 2019 Apr.

Abstract

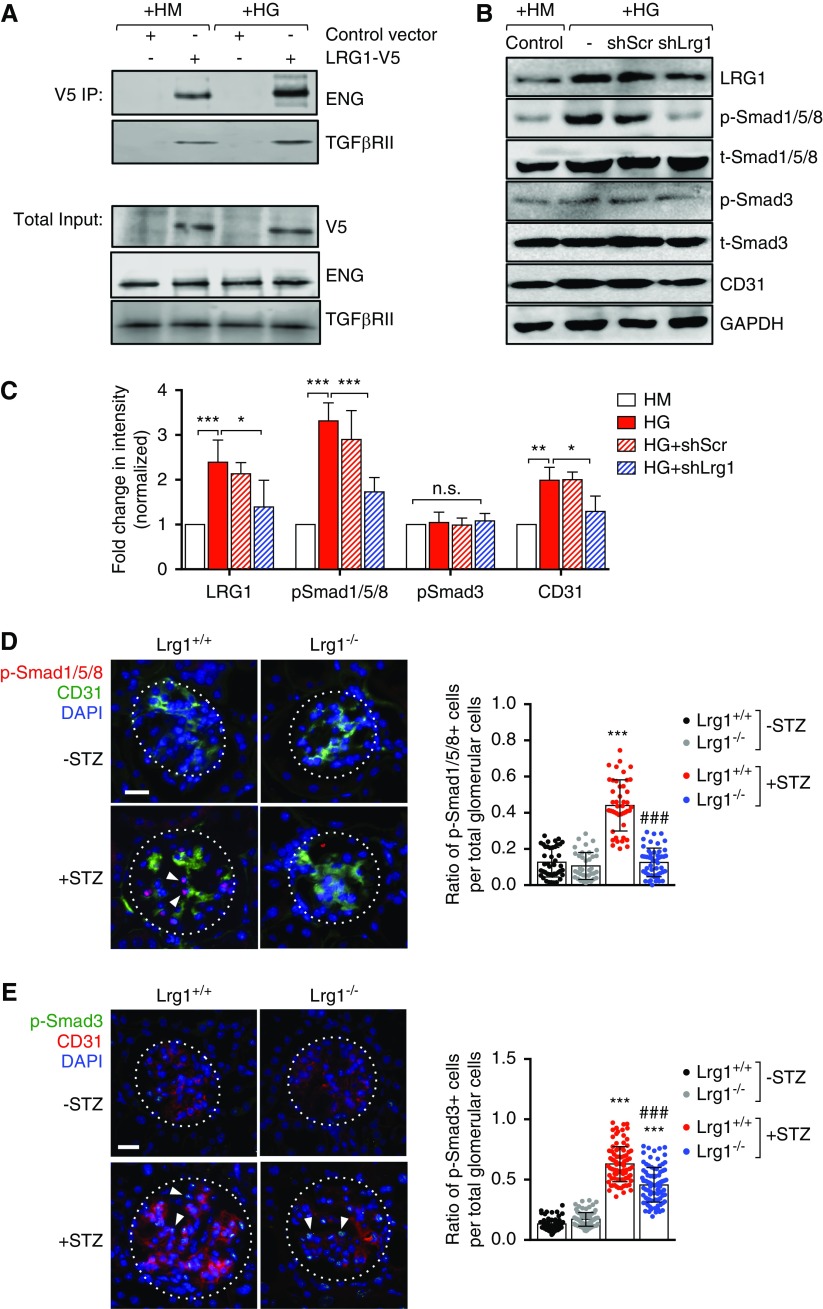
Background: Glomerular endothelial dysfunction and neoangiogenesis have long been implicated in the pathogenesis of diabetic kidney disease (DKD). However, the specific molecular pathways contributing to these processes in the early stages of DKD are not well understood. Our recent transcriptomic profiling of glomerular endothelial cells identified a number of proangiogenic genes that were upregulated in diabetic mice, including leucine-rich α-2-glycoprotein 1 (LRG1). LRG1 was previously shown to promote neovascularization in mouse models of ocular disease by potentiating endothelial TGF-β/activin receptor-like kinase 1 (ALK1) signaling. However, LRG1's role in the kidney, particularly in the setting of DKD, has been unclear.

Methods: We analyzed expression of LRG1 mRNA in glomeruli of diabetic kidneys and assessed its localization by RNA in situ hybridization. We examined the effects of genetic ablation of Lrg1 on DKD progression in unilaterally nephrectomized, streptozotocin-induced diabetic mice at 12 and 20 weeks after diabetes induction. We also assessed whether plasma LRG1 was associated with renal outcome in patients with type 2 diabetes.

Results: LRG1 localized predominantly to glomerular endothelial cells, and its expression was elevated in the diabetic kidneys. LRG1 ablation markedly attenuated diabetes-induced glomerular angiogenesis, podocyte loss, and the development of diabetic glomerulopathy. These improvements were associated with reduced ALK1-Smad1/5/8 activation in glomeruli of diabetic mice. Moreover, increased plasma LRG1 was associated with worse renal outcome in patients with type 2 diabetes.

Conclusions: These findings identify LRG1 as a potential novel pathogenic mediator of diabetic glomerular neoangiogenesis and a risk factor in DKD progression.

Keywords: TGF-beta; diabetic nephropathy; glomerular endothelial cells; proteinuria.


Figures

None
Graphical abstract
Figure 1.
Figure 1.
LRG1 expression is increased in glomeruli of mouse and human diabetic kidneys. (A) RNA-sequencing data of Lrg1 expression in isolated GECs of vehicle- or STZ-injected eNOS−/− mice (reproduced from Fu et al.). Each sample represents isolated GECs pooled from three to four mice. RPKM, reads per kilobase million. (B) Levels of Lrg1 mRNA in isolated glomeruli of STZ-induced diabetic DBA/2J, and db/db and in eNOS−/− db/db mice in C57BLKS background compared with their respective nondiabetic controls from Nephroseq database (nephroseq.org). (C) In situ hybridization detecting Lrg1 mRNA (blue) and Pecam (CD31) mRNA (pink) in kidneys of diabetic OVE26 mice and wild-type control mice (FVB WT). Magnified view of the outlined glomeruli in the upper panel is shown in the lower panels. Arrows highlight examples of Lrg1 expression in renal tubules and arrowhead highlight examples of Lrg1 expression that colocalize with CD31 outside the tubules. Scale bars, 20 μm. (D) Semiquantitative scoring of Lrg1 mRNA colocalized with Pecam mRNA (n=3 mice per group, 20 gloms scored per mouse). (E) In situ hybridization of LRG1 mRNA (red) combined with CD31 immunofluorescence (green) on human kidney sections with nuclear counterstain. Glomeruli are outlined with dotted lines on upper panels, and magnified view of the box is shown in lower panels. Scale bar, 50 μm. (F) Semiquantitative scoring of LRG1 mRNA colocalized with CD31 (n=3 kidneys per group, 15 gloms scored per kidney).
Figure 2.
Figure 2.
LRG1 ablation protects against diabetic glomerulopathy. (A) Schematics of the experimental design. UNx was performed in 8-week-old Lrg1+/+ and Lrg1−/− mice 3 weeks before injection of STZ or citrate buffer vehicle. Mice were euthanized at 12 weeks postinjection for analysis (n=6–8 mice per group). (B) Biweekly blood glucose measurements of control and diabetic mice. (C) Kidney-to-body weight (BW) ratio at 12 weeks post-DM induction. (D) Representative images of periodic acid-Schiff (PAS)-stained kidneys. Scale bar, 20 μm. (E) Quantification of glomerular volume and mesangial matrix fraction per mouse (20–30 gloms counted per mouse, n=6 mice). (F) Urinary albumin-to-creatinine ratio (UACR) over time (n=6 per group). (G) Twenty four-hour urinary albumin excretion (UAE) at 12 weeks postinjection (n=6 mice per group). *P<0.05; **P<0.01; and ***P<0.001 versus respective nondiabetic controls; #P<0.05; ##P<0.01; and ###P<0.001 versus diabetic Lrg1+/+ mice.
Figure 3.
Figure 3.
LRG1 ablation reduces podocyte foot process effacement. (A) Representative transmission electron microscopy images of mouse glomeruli. Red arrowheads highlight effaced podocyte foot processes. Scale bar, 5 μm. (B) Quantification of average podocyte foot process width per mouse (n=5–6 mice per group, 10–20 fields analyzed per mouse). (C) Representative images of p57 immunofluorescence. Glomeruli are outlined with dotted white lines. Scale bar, 20 μm. (D) Quantification of number of p57-positive podocytes per mouse (n=5 mice per group, 20–30 gloms scored per mouse). ***P<0.001 versus nondiabetic control; ##P<0.01 and ###P<0.001 versus diabetic Lrg1+/+ mice.
Figure 4.
Figure 4.
LRG1 ablation attenuates angiogenesis in vivo. (A) Schematics of the experimental design. UNx was performed in 8-week-old Lrg1+/+ and Lrg1−/− mice 3 weeks before injection of either low doses of STZ or citrate buffer vehicle. Directed in vivo angiogenesis assay (DIVAA) was performed at 7 weeks postinjection, and implanted angioreactors were taken out after 2 weeks (n=6 mice per group). (B) Images of angioreactors 14 days postimplantation. Positive control (Pos.) angioreactor was supplemented with FGF and VEGF, negative control (Neg.) was supplemented with no factors, and all others were supplemented with FGF alone. Quantification of FITC-lectin bound dissociated cells from angioreactors is shown on the right. (C) Representative CD31 immunofluorescence images and quantification of CD31-positive glomerular area per mouse (n=5 mice per group, 20–30 glomeruli per mouse). (D) Two-photon microscopy imaging and quantification of glomerular EYFP-positive cells in Lrg1+/+;EYFP and Lrg1−/−;EYFP mice (n=3 mouse, ten sections per mouse). (E) Representative 8-oxo-dG/CD31 immunofluorescence images and quantification of 8-oxo-dG glomerular area per mouse (n=5 mice per group, 20–30 glomeruli per mouse). Scale bar, 20 μm. *P<0.05 and ***P<0.001 versus nondiabetic controls; ##P<0.01 and ###P<0.001 versus diabetic Lrg1+/+.
Figure 5.
Figure 5.
LRG1 potentiates the ALK1-Smad1/5/8 pathway in GECs in diabetic conditions. (A) Immunoprecipitation with anti-V5 antibody using lysates of conditionally immortalized mGECs transduced with pHR lentiviral vector (Control vector) or pHR expressing recombinant V5-tagged LRG1 (LRG1-V5) cultured under high mannitol (HM) or high glucose (HG) conditions for 48 hours. Recombinant LRG1 coimmunoprecipitates with endogenous ENG and TGF-β receptor type 2 (TβRII) in mGECs in both conditions. (B and C) Effects of Lrg1 knockdown was examined in mGECs transduced with pLKO lentiviral vector (−), pLKO vector expressing scrambled shRNA (shScr), or shRNA against LRG1 (shLrg1). Lysates were subjected to Western blot analysis using primary antibodies as indicated. Representative western blot image (of triplicate experiments) is shown in (B) and densitometric analysis is shown in (C). *P<0.05; **P<0.01; and ***P<0.001 when compared between indicated groups by ANOVA with Tukey corrections. (D and E) Immunostaining of (D) phospho-Smad1/5/8 (p-Smad1/5/8) and CD31 or (E) phospho-Smad3 (p-Smad3) and CD31 on frozen kidney sections of Lrg1+/+ and Lrg1−/− mice. The ratio of p-Smad1/5/8–positive or p-Smad3–positive cells per total glomerular cells per kidney section is shown on the right (n=3 mice, 15–20 sections scored per mouse). Scale bar, 20 μm. White arrowheads show examples of nuclear-localized p-Smad1/5/8 or p-Smad3. ***P<0.001 versus nondiabetic control; ###P<0.001 versus diabetic Lrg1+/+.
Figure 6.
Figure 6.
Renoprotection by LRG1 loss persists in the later stage of DKD. (A) Schematics of the experimental design. UNx was performed in 8-week-old Lrg1+/+ and Lrg1−/− mice 3 weeks before injection of low doses of either STZ or citrate buffer vehicle. Mice were euthanized at 20 weeks postinjection for analysis (n=5–8 mice per group). (B) Representative image of kidneys stained with periodic acid–Schiff at low magnification (top panels; scale bar, 50 μm) and at high magnification (bottom panels; scale bar, 20 μm). (C) Quantification of glomerular volume and mesangial fraction at 20 weeks post-DM induction per mouse (n=6 mice per group, 20–30 gloms scored per mouse). (D) Renal function assessment at 20 weeks post-DM of 24-hour urinary albumin excretion (UAE) levels and BUN levels (n=5–8 mouse per group). ***P<0.001 versus respective nondiabetic controls; ##P<0.01 and ###P<0.001 versus diabetic Lrg1+/+ mice.
Figure 7.
Figure 7.
LRG1 loss confers protection against podocyte and endothelial cell injury at the later stage of DKD. (A) Transmission electron microscopy images of Lrg1+/+ and Lrg1−/− mouse kidneys at ×10,000 magnification (scale bar, 5 μm). Red arrowheads highlight the severe effacement of podocyte foot processes in the diabetic Lrg1+/+ mice. Quantification of average podocyte foot process widths (PFWs) and glomerular basement membrane (GBM) widths are shown on the right (n=3 mice per group, ten fields per mouse). (B) Representative images of p57 immunofluorescence and quantification per mouse (n=5 mice per group, 20–30 gloms scored per mouse). (C) Representative 8-oxo-dG and CD31 immunofluorescence images and quantification of 8-oxo-dG glomerular area per mouse. (D) Two-photon microscopy imaging and quantification of glomerular EYFP-positive cells in Lrg1+/+;EYFP and Lrg1−/−;EYFP mice (n=3 mouse, ten sections per mouse; Supplemental Files 5 and 6 show examples of the z-stacks). Scale bar, 20 μm. *P<0.05; **P<0.01; ***P<0.001 versus respective nondiabetic controls; ###P<0.001 versus diabetic Lrg1+/+ mice.
Figure 8.
Figure 8.
Plasma LRG1 is associated with renal outcome in patients with type 2 DM. Kaplan–Meier curves stratified by tertiles of plasma LRG1 for the composite renal outcome of sustained 40% decline in eGFR or ESRD.

References

    1. US Renal Data System : Annual Data Report: Atlas of End-Stage-Renal-Disease in the United States, 2011. Available at : https://www.usrds.org/atlas11.aspx. Accessed February 24, 2019
    1. Lewis EJ, Hunsicker LG, Bain RP, Rohde RD; The Collaborative Study Group : The effect of angiotensin-converting-enzyme inhibition on diabetic nephropathy. N Engl J Med 329: 1456–1462, 1993 - PubMed
    1. Lewis EJ, Hunsicker LG, Clarke WR, Berl T, Pohl MA, Lewis JB, et al. .: Collaborative Study Group : Renoprotective effect of the angiotensin-receptor antagonist irbesartan in patients with nephropathy due to type 2 diabetes. N Engl J Med 345: 851–860, 2001 - PubMed
    1. Brenner BM, Cooper ME, de Zeeuw D, Keane WF, Mitch WE, Parving HH, et al. .: RENAAL Study Investigators : Effects of losartan on renal and cardiovascular outcomes in patients with type 2 diabetes and nephropathy. N Engl J Med 345: 861–869, 2001 - PubMed
    1. de Zeeuw D, Heerspink HJL: Unmet need in diabetic nephropathy: Failed drugs or trials? Lancet Diabetes Endocrinol 4: 638–640, 2016 - PubMed

Publication types

MeSH terms