. 2019 Mar 11;10(1):1154.
doi: 10.1038/s41467-019-09134-9.

Whole-genome resequencing reveals Brassica napus origin and genetic loci involved in its improvement

Affiliations

Whole-genome resequencing reveals Brassica napus origin and genetic loci involved in its improvement

Kun Lu et al. Nat Commun. .

Abstract

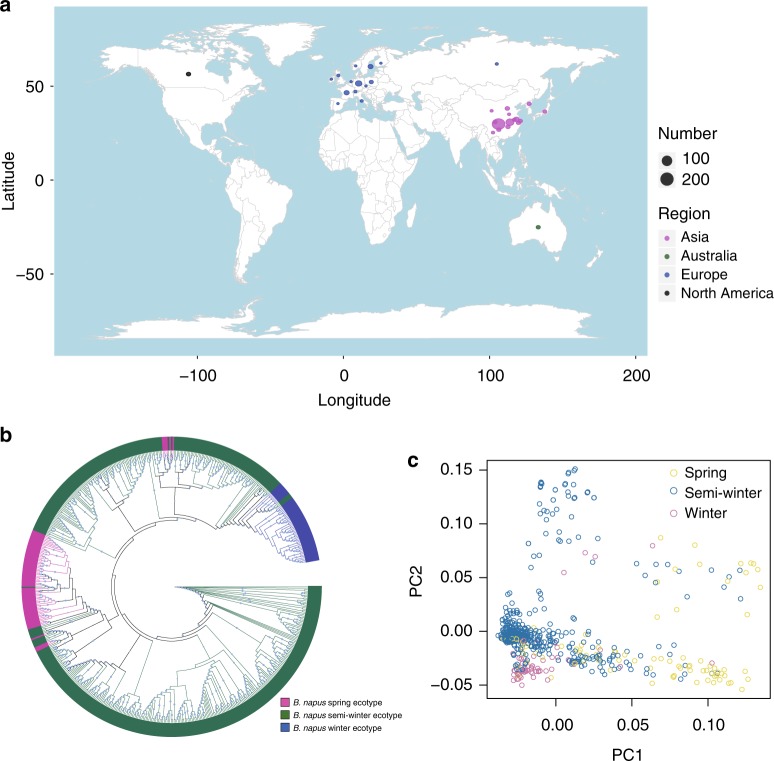
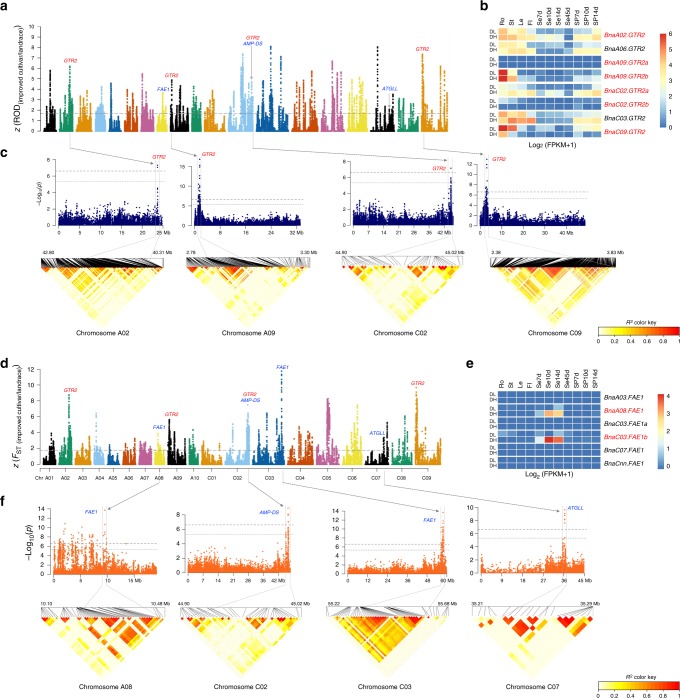
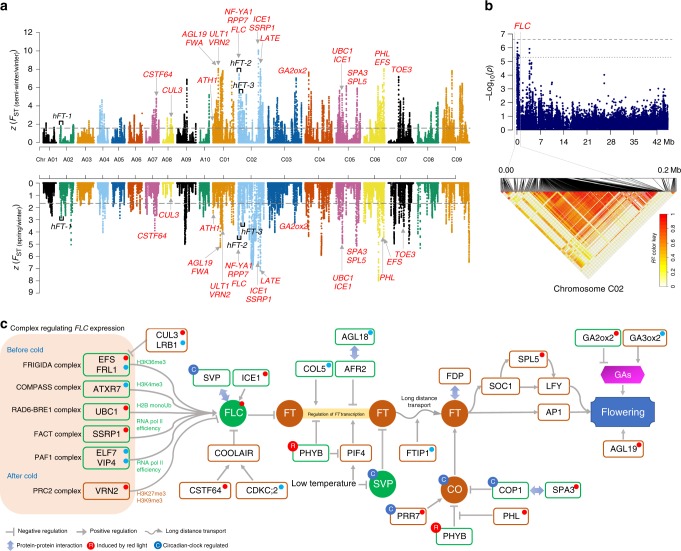
Brassica napus (2n = 4x = 38, AACC) is an important allopolyploid crop derived from interspecific crosses between Brassica rapa (2n = 2x = 20, AA) and Brassica oleracea (2n = 2x = 18, CC). However, no truly wild B. napus populations are known; its origin and improvement processes remain unclear. Here, we resequence 588 B. napus accessions. We uncover that the A subgenome may evolve from the ancestor of European turnip and the C subgenome may evolve from the common ancestor of kohlrabi, cauliflower, broccoli, and Chinese kale. Additionally, winter oilseed may be the original form of B. napus. Subgenome-specific selection of defense-response genes has contributed to environmental adaptation after formation of the species, whereas asymmetrical subgenomic selection has led to ecotype change. By integrating genome-wide association studies, selection signals, and transcriptome analyses, we identify genes associated with improved stress tolerance, oil content, seed quality, and ecotype improvement. They are candidates for further functional characterization and genetic improvement of B. napus.


Conflict of interest statement

The authors declare no competing interests.

Figures

Fig. 1
Fig. 1
Geographic distribution and population structure of B. napus accessions. a Geographic distribution of 588 B. napus accessions in the world. b ML tree of all B. napus accessions inferred from SNPs at fourfold-degenerate sites. Phylogenetic tree was constructed using IQ-TREE with the best model GTR + F + ASC + R5. Clades with bootstrap values of above 50% are indicated by a circled blue dot. c PCA plot of all the B. napus accessions used in this study. a was generated in R (V3.2.5) using package rworldmap. Source data are provided as a Source Data file
Fig. 2
Fig. 2
Population structure of 588 B. napus accessions and 199 of B. rapa accessions. a ML tree of all B. napus accessions and 199 B. rapa accessions inferred from SNPs at fourfold-degenerate sites. Phylogenetic tree was constructed using IQ-TREE with the best model GTR + F + ASC + R7. Clades with bootstrap values of above 50% are indicated by a circled blue dot. b PCA plot of 50 B. napus landraces and 199 B. rapa accessions. c Model-based Bayesian clustering of 50 B. napus landraces and 199 B. rapa accessions performed using STRUCTURE 2.1 with the number of ancestry kinships (K) set to 2, 3, or 4. Each accession is denoted by a vertical bar composed of different colors in proportions corresponding to its proportion of genetic ancestry from each of these ancestral populations. Source data are provided as a Source Data file
Fig. 3
Fig. 3
Population structure of 588 B. napus accessions and 119 of B. oleracea accessions. a ML tree of all B. napus accessions and 119 B. oleracea accessions inferred from SNPs at fourfold-degenerate sites. Phylogenetic tree was constructed using IQ-TREE with the best model TVM + F + ASC + R8. Clades with bootstrap values of above 50% are indicated by a circled blue dot. b PCA plot of 50 B. napus landraces and 119 B. oleracea accessions. c Model-based Bayesian clustering of 50 B. napus landraces and 119 B. oleracea accessions performed using STRUCTURE 2.1 with the number of ancestry kinships (K) set to 2, 3, or 4. Each accession is denoted by a vertical bar composed of different colors in proportions corresponding to its proportion of genetic ancestry from each of these ancestral populations. Source data are provided as a Source Data file
Fig. 4
Fig. 4
Genome-wide scanning and annotations of selected regions during the SSI of B. napus. a, d Genome-wide screening of SSI-selection signals with ROD and FST. ROD and FST were normalized as z scores for B. napus. A 100-kb sliding window with an increment of 10 kb was used to calculate these values. Each point represents a value in a 100-kb window. Horizontal dashed lines show the significance level of α = 0.05, corresponding to z = 1.645. The glucosinolate transport genes in the selection outlier regions are labeled in red, and erucic acid biosynthesis genes are in blue. b, e Expression patterns of two GTR2 and FAE1 family members. Genes in the selection outlier regions during the SSI are in red. DH double-high accession Zhongyou821, DL double-low accession Zhongshuang11, Ro root, St stem, Le leaf, Fl flower, Se7d, 10d, 14d, and 45d seeds at 7, 10, 14, and 45 days after flowering, SP7d, 10d, and 14d silique pericarp at 7, 10, and 14 days after flowering. c, f GWAS results of total glucosinolate and erucic acid content that overlapped selection signals. Dashed horizontal lines depict the significant (−log10(P) = 6.61) and suggestive (−log10(P) = 5.31) thresholds. The lower panel shows the LD blocks of significantly associated loci in GWAS. Source data are provided as a Source Data file
Fig. 5
Fig. 5
Overview of flowering-time regulation under the selection of the ecotype improvement of B. napus. a Genome-wide screening of ecotype improvement selection signals of FST (semi-winter/winter) and FST (spring/winter). Flowering-time genes simultaneously identified in selection outlier regions between winter and spring ecotypes, and between winter and semi-winter ecotypes are labeled in red in the corresponding chromosomes. Full descriptions of these genes are shown in Supplementary Data 36. Three LD blocks containing significant GWAS associations for flowering time are labeled in black. b GWAS results of flowering time that overlapped with selection signals. Dashed horizontal lines depict the significant (−log10(P) = 6.61) and suggestive (−log10(P) = 5.31) thresholds. Lower panel shows the LD blocks of significantly associated loci in GWAS. c Major flowering-time pathways and selective effects acting on their components during ecotype improvement. Brown and green rounded rectangles represent proteins involved in positive and negative regulation of flowering time, respectively. Flowering integrator proteins are shown in brown and green dots, respectively. Red dots at the top right of gene symbols represent flowering-time-regulation genes simultaneously identified in the selection outlier regions both semi-winter/winter and spring/winter comparisons, and purple and blue dots represent those of spring/winter and semi-winter/winter comparisons, respectively. Source data are provided as a Source Data file

References

    1. Allender CJ, King GJ. Origins of the amphiploid species Brassica napus L. investigated by chloroplast and nuclear molecular markers. BMC Plant Biol. 2010;10:54. - PMC - PubMed
    1. Snowdon, R., Lühs, W. & Friedt, W. Oilseeds Ch. 2 (Springer, Berlin, Heidelberg, 2007).
    1. Nagaharu U. Genome analysis in Brassica with special reference to the experimental formation of B. napus and peculiar mode of fertilization. Jpn J. Bot. 1935;7:389–452.
    1. Sun F, et al. The high-quality genome of Brassica napus cultivar ‘ZS11’ reveals the introgression history in semi-winter morphotype. Plant J. 2017;92:452–468. - PubMed
    1. Chalhoub B, et al. Early allopolyploid evolution in the post-Neolithic Brassica napus oilseed genome. Science. 2014;345:950–953. - PubMed

Publication types