. 2019 Mar 11;9(1):4159.
doi: 10.1038/s41598-019-40128-1.

Tissue-specific extracellular matrix accelerates the formation of neural networks and communities in a neuron-glia co-culture on a multi-electrode array

Affiliations

Tissue-specific extracellular matrix accelerates the formation of neural networks and communities in a neuron-glia co-culture on a multi-electrode array

Doris Lam et al. Sci Rep. .

Abstract

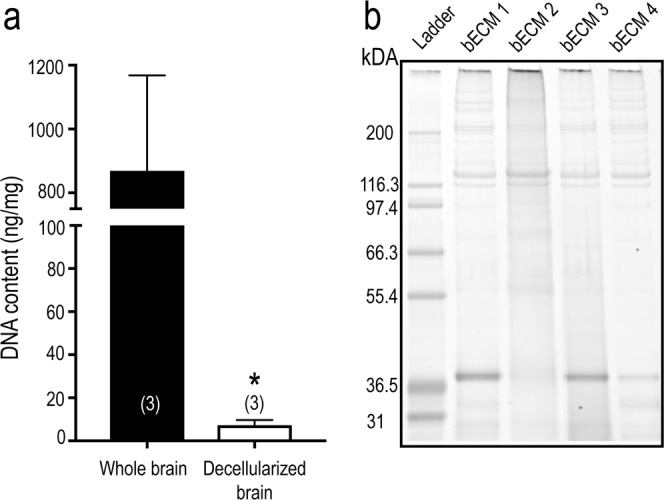
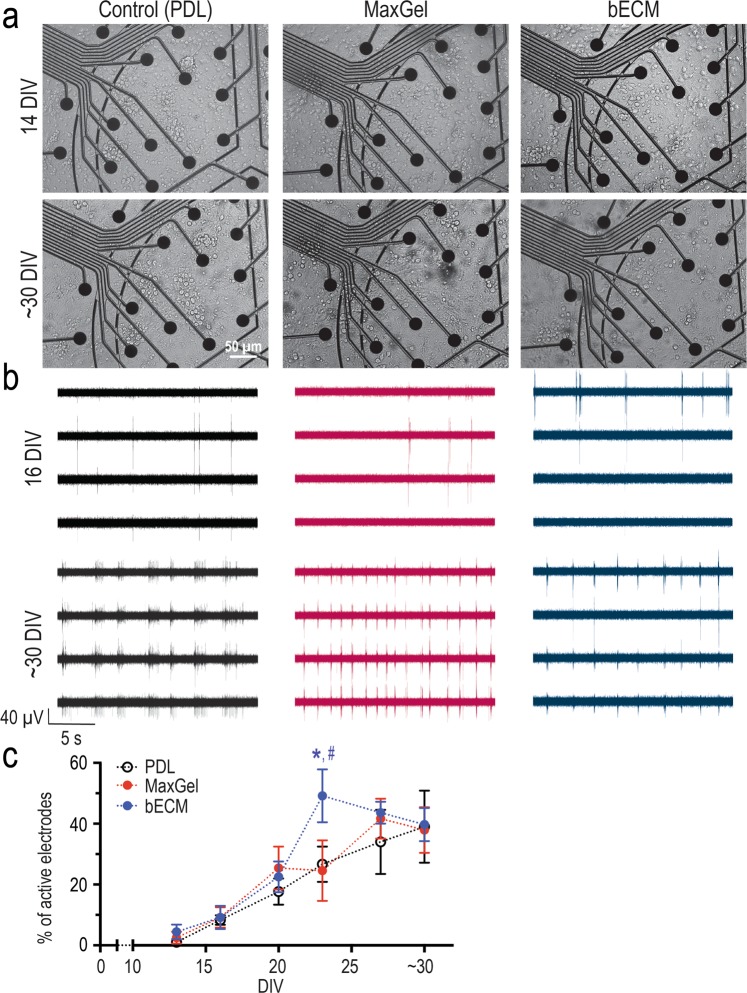
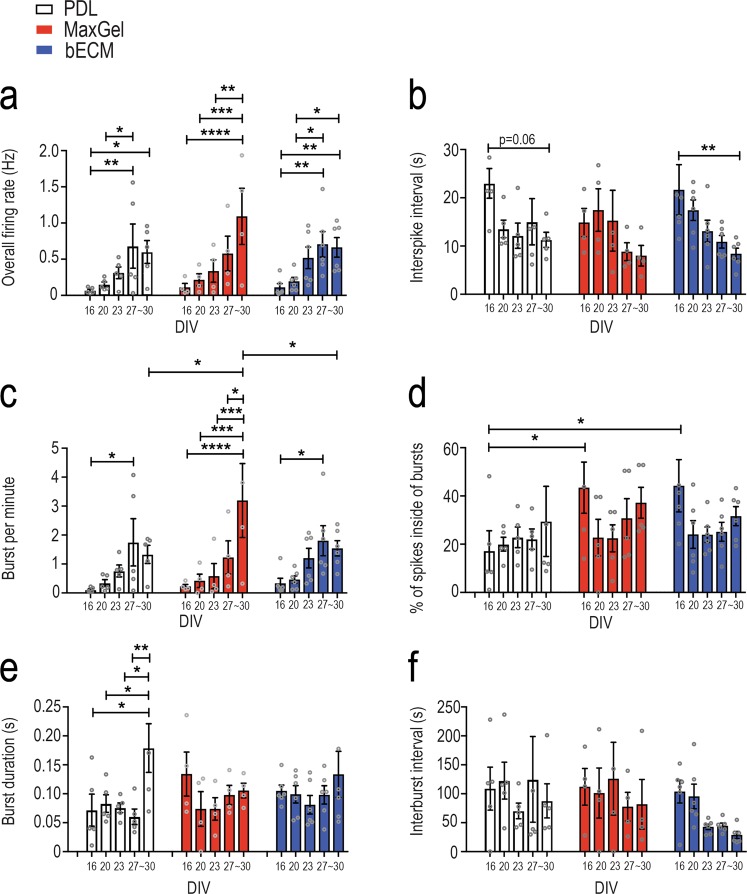
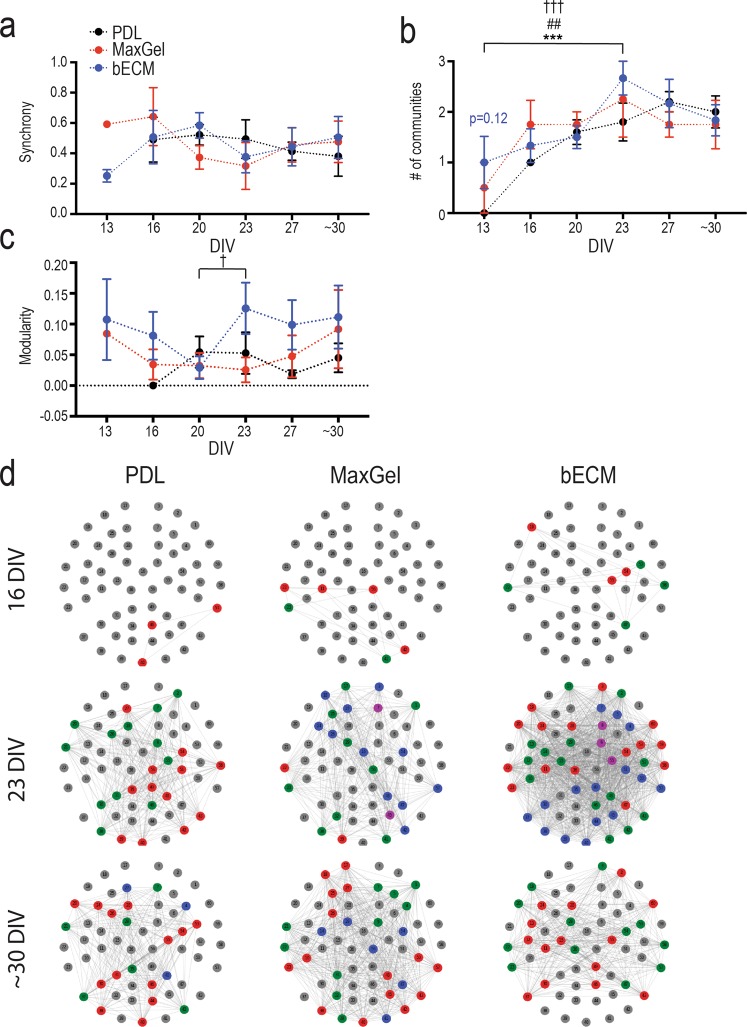
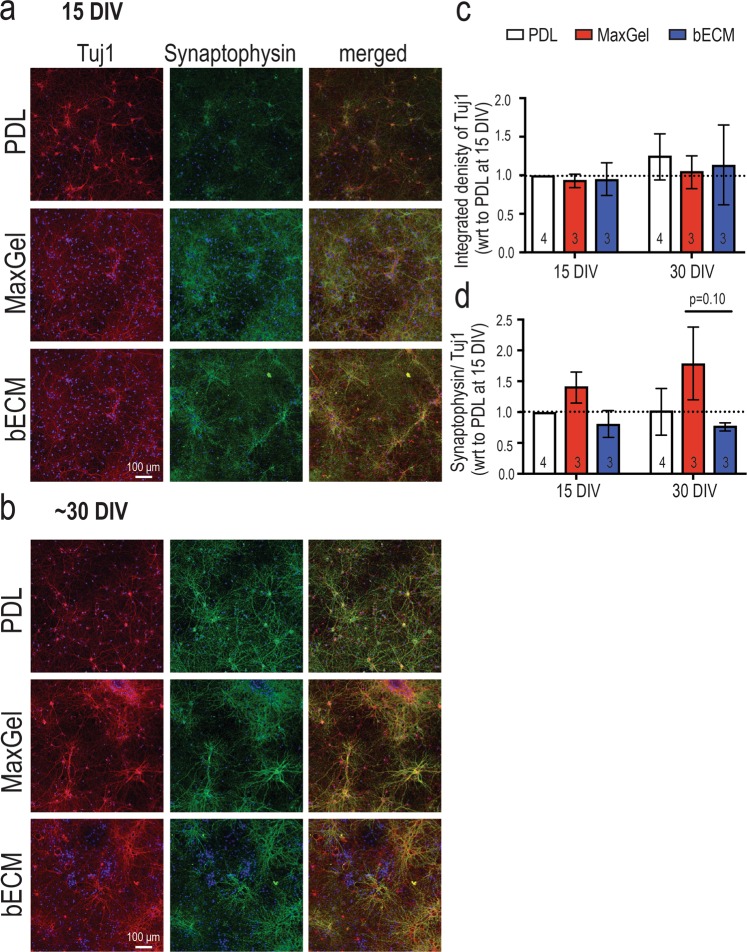
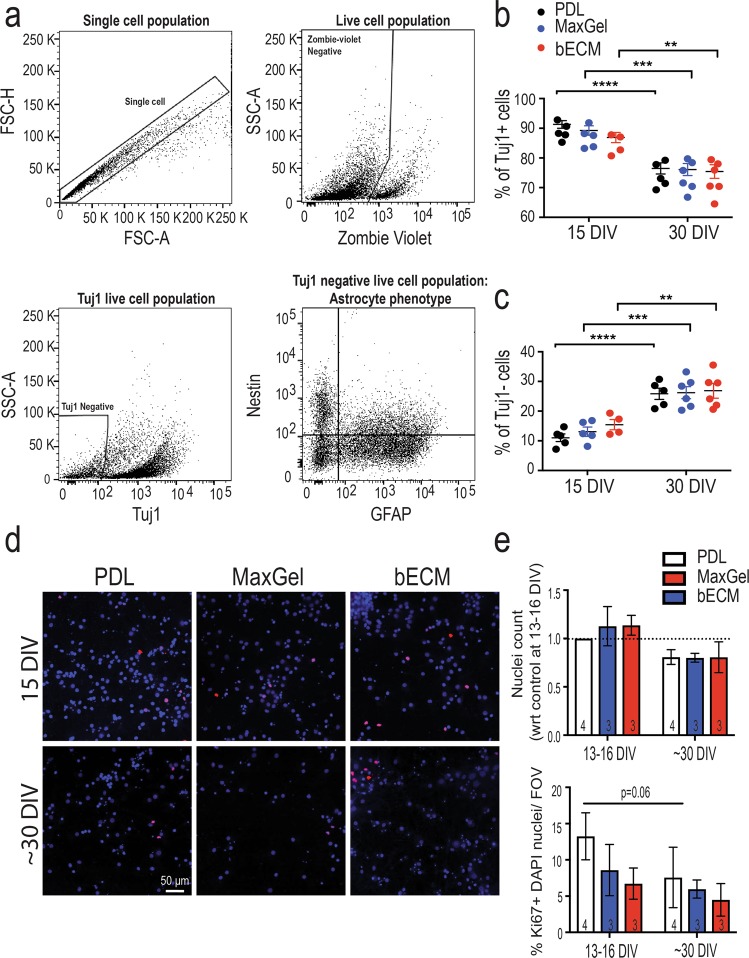
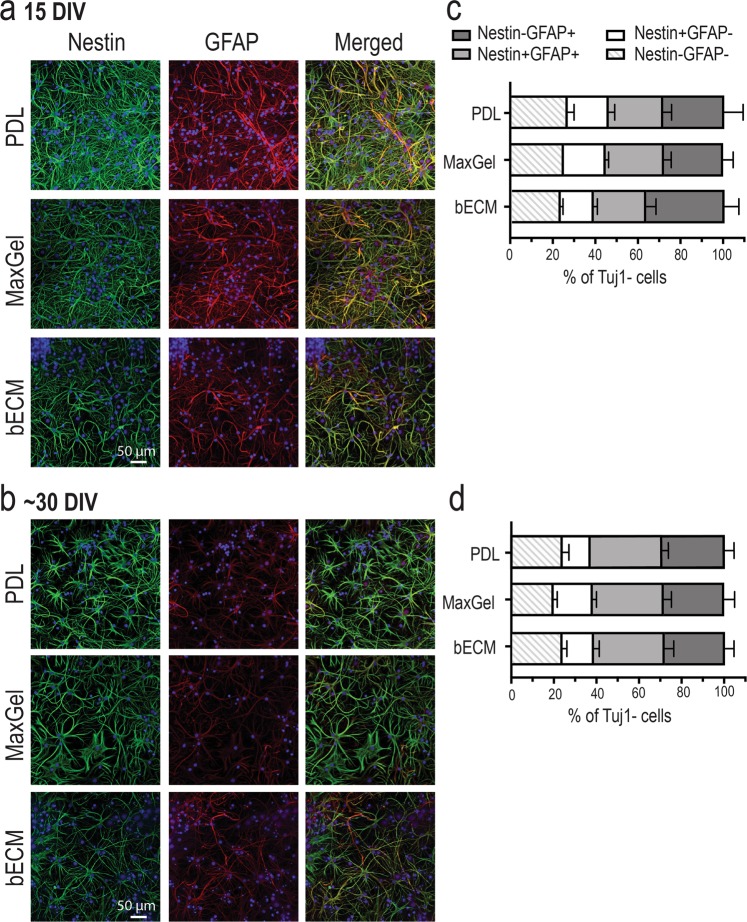
The brain's extracellular matrix (ECM) is a macromolecular network composed of glycosaminoglycans, proteoglycans, glycoproteins, and fibrous proteins. In vitro studies often use purified ECM proteins for cell culture coatings, however these may not represent the molecular complexity and heterogeneity of the brain's ECM. To address this, we compared neural network activity (over 30 days in vitro) from primary neurons co-cultured with glia grown on ECM coatings from decellularized brain tissue (bECM) or MaxGel, a non-tissue-specific ECM. Cells were grown on a multi-electrode array (MEA) to enable noninvasive long-term interrogation of neuronal networks. In general, the presence of ECM accelerated the formation of networks without affecting the inherent network properties. However, specific features of network activity were dependent on the type of ECM: bECM enhanced network activity over a greater region of the MEA whereas MaxGel increased network burst rate associated with robust synaptophysin expression. These differences in network activity were not attributable to cellular composition, glial proliferation, or astrocyte phenotypes, which remained constant across experimental conditions. Collectively, the addition of ECM to neuronal cultures represents a reliable method to accelerate the development of mature neuronal networks, providing a means to enhance throughput for routine evaluation of neurotoxins and novel therapeutics.


Conflict of interest statement

The authors declare no competing interests.

Figures

Figure 1
Figure 1
Characterization of decellularized postnatal rat brain ECM. (a) The decellularization protocol (see Methods) removed ~99.2% of the DNA content from the brain tissue versus a whole brain. (b) SDS-PAGE elucidated the electrophoretic mobility and banding pattern of decellularized bECM favoring high molecular weight proteins, and the reproducibility of the decellularization process on the postnatal rat brain tissue across 4 litters (n = 3 brains/litter). Black box indicates cropped gel. Full-length gel, including MaxGel samples, is presented in Supplementary Fig. 1. Results were analyzed using unpaired t-test, with statistical significance at a level of *p < 0.05.
Figure 2
Figure 2
Biocompatibility of ECM coatings for long-term neuron-glia co-cultures. (a) Brightfield microscopy was used to monitor neurons co-cultured with glia grown on MEA devices (and control plates, not shown) in the absence (control, left panels) and presence of ECM coatings, MaxGel (middle panels) or bECM (right panels). Scale bar = 50 μm. (b) Representative traces of neuronal activity observed at 16 and ~30 DIV. (c) Line graph summarizes the number of active electrodes across ~30 DIV. Data are mean ± SEM for the number of devices in control (n = 5), MaxGel (n = 4) and bECM (n = 6) and were analyzed using repeated measures two-way ANOVA with Tukey’s post hoc test. Statistical significances are indicated between PDL and bECM (*) and bECM and MaxGel (#) at a significance level of p < 0.05.
Figure 3
Figure 3
Features of neural network activity for co-cultures grown in the presence and absence of an ECM coating. Bar graph summarizes each electrophysiology feature across a period of ~30 DIV for each experimental condition: PDL (white), MaxGel (red), and bECM (blue). Features of neural activity include: overall firing rate (a), interspike interval (b), burst per minute (c), percentage of spikes inside of bursts (d), burst duration (e) and interburst interval (f). Individual data points are represented as open circles, and summary data bars are presented as mean ± SEM for the number of devices in PDL (n = 5), MaxGel (n = 4) and bECM (n = 6). Data were analyzed using repeated measures two-way ANOVA with Tukey’s post hoc test. Statistical significances are at a level of *p < 0.05, **p < 0.01, ***p < 0.001, and ****p < 0.0001.
Figure 4
Figure 4
Synchrony and community structure of neural networks formed in the presence and absence of an ECM coating. Line graph summarizes the degree of synchrony between active electrodes on MEA devices (a), the number of communities formed (b), and the modularity score of these communities (c) across ~30 DIV for PDL (black), MaxGel (red), and bECM (blue) experimental conditions. (d) Representative MEA plots for PDL (left), MaxGel (middle), and bECM (right) that display 60 electrodes (numbered from 1–60), which are either inactive (grey) or active and part of a community (color) at 16 (top), 23 (middle), and ~30 (bottom) DIV. Data is presented as mean ± SEM for the number of devices in PDL (n = 5), MaxGel (n = 4) and bECM (n = 6) and were analyzed using two-way ANOVA with Tukey’s post hoc test. Statistical significances between time points are at a level of #p < 0.05, ##p < 0.01 and ###p < 0.001 for PDL (*), MaxGel (#), and bECM ().
Figure 5
Figure 5
Synaptophysin expression in Tuj1-positive cells grown in the presence and absence of an ECM coating. Representative fluorescent images showing Tuj1-positive neurons (red) and synaptophysin expression (green) at 15 DIV (a) and 30 DIV (b). Scale bar = 100 μm. Bar graphs summarize the integrated density of Tuj1 (c) and synaptophysin normalized to Tuj1 (d) per field of view. Data are expressed as a fold change relative to PDL group at 15 DIV, as shown by the dash line, presented as mean ± SEM for the number of cultures indicated at the base of each bar (n = 3–4 biological repeats), and were analyzed using two-way ANOVA with Tukey’s post hoc test.
Figure 6
Figure 6
Characterization of cellular composition. Flow cytometry analysis of primary neuron and glial cells co-cultured in the presence or absence of an ECM coating. (a) Representative flow cytometry plots illustrate the gating strategy for the co-culture system: single cell population (top left) was gated based on forward-scatter characteristics, Zombie viability dye was used to exclude dead cells (high fluorescence) (top right), and Tuj1 staining was used to identify neuronal (Tuj1+) and glia (Tuj1−) subpopulation of cells (bottom left). The glial subpopulation (Tuj1− cells) was further gated to determine the phenotype of the astrocytic population based on nestin and GFAP expression (bottom right). Scatter plots summarizing the % of Tuj1+ (b) and % Tuj1− cells (c) from PDL, MaxGel, and bECM culture conditions across time (n = 2–3 cultures from 2 biological repeats). (d) Representative fluorescent images of DAPI-stained nuclei (blue) and those positive for the Ki67 proliferative marker (red). Scale bar = 50 μm. (e) Bar graph summarizes the total nuclei count (top) and % of Ki67 + nuclei (bottom). Data are mean ± SEM for the number of cultures (n = 3–4 biological repeats) indicated at the base of each bar and were analyzed using two-way ANOVA with Tukey’s post hoc test. Statistical significances between time points are at a level of **p < 0.01, ***p < 0.001, ****p < 0.0001.
Figure 7
Figure 7
Phenotypic profiling of astrocytes in the presence and absence of an ECM coating. Representative fluorescent images showing a heterogenous population of cells expressing nestin and GFAP at 15 DIV (a) and ~30 DIV (b). Scale bar = 50 μm. Bar graph summarizes flow cytometry data highlighting the distribution of astrocytic phenotypes (Nestin−GFAP−, Nestin+GFAP−, Nestin+GFAP+, Nestin−GFAP+) at 15 DIV (c) and ~30 DIV (d). Data are mean ± SEM for the number of cultures (n = 3–4 biological repeats).

References

    1. Nicholson C, Sykova E. Extracellular space structure revealed by diffusion analysis. Trends Neurosci. 1998;21:207–215. - PubMed
    1. Dityatev A, Schachner M, Sonderegger P. The dual role of the extracellular matrix in synaptic plasticity and homeostasis. Nat Rev Neurosci. 2010;11:735–746. doi: 10.1038/nrn2898. - DOI - PubMed
    1. Song I, Dityatev A. Crosstalk between glia, extracellular matrix and neurons. Brain Res Bull. 2018;136:101–108. doi: 10.1016/j.brainresbull.2017.03.003. - DOI - PubMed
    1. Burnside ER, Bradbury EJ. Manipulating the extracellular matrix and its role in brain and spinal cord plasticity and repair. Neuropathol Appl Neurobiol. 2014;40:26–59. doi: 10.1111/nan.12114. - DOI - PubMed
    1. Blau A. Cell adhesion promotion strategies for signal transduction enhancement in microelectrode array in vitro electrophysiology: An introductory overview and critical discussion. Current Opinion in Colloid & Interface Science. 2013;18:481–492. doi: 10.1016/j.cocis.2013.07.005. - DOI

Publication types

MeSH terms