. 2019 Mar 11;9(1):4050.
doi: 10.1038/s41598-019-40546-1.

Signs of biological activities of 28,000-year-old mammoth nuclei in mouse oocytes visualized by live-cell imaging

Affiliations

Signs of biological activities of 28,000-year-old mammoth nuclei in mouse oocytes visualized by live-cell imaging

Kazuo Yamagata et al. Sci Rep. .

Abstract

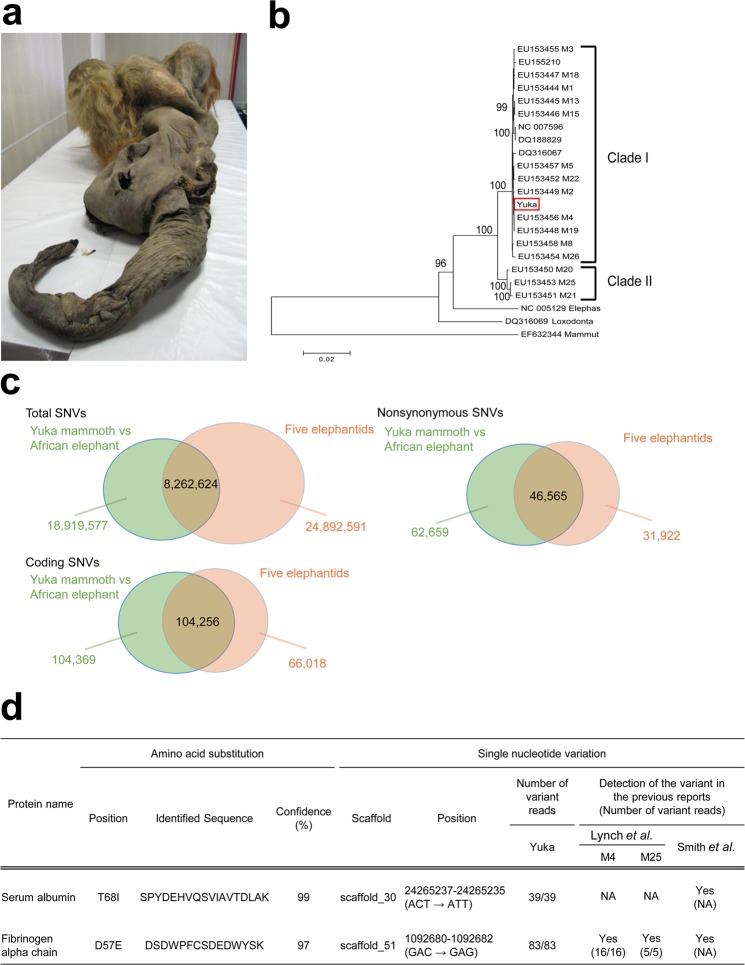
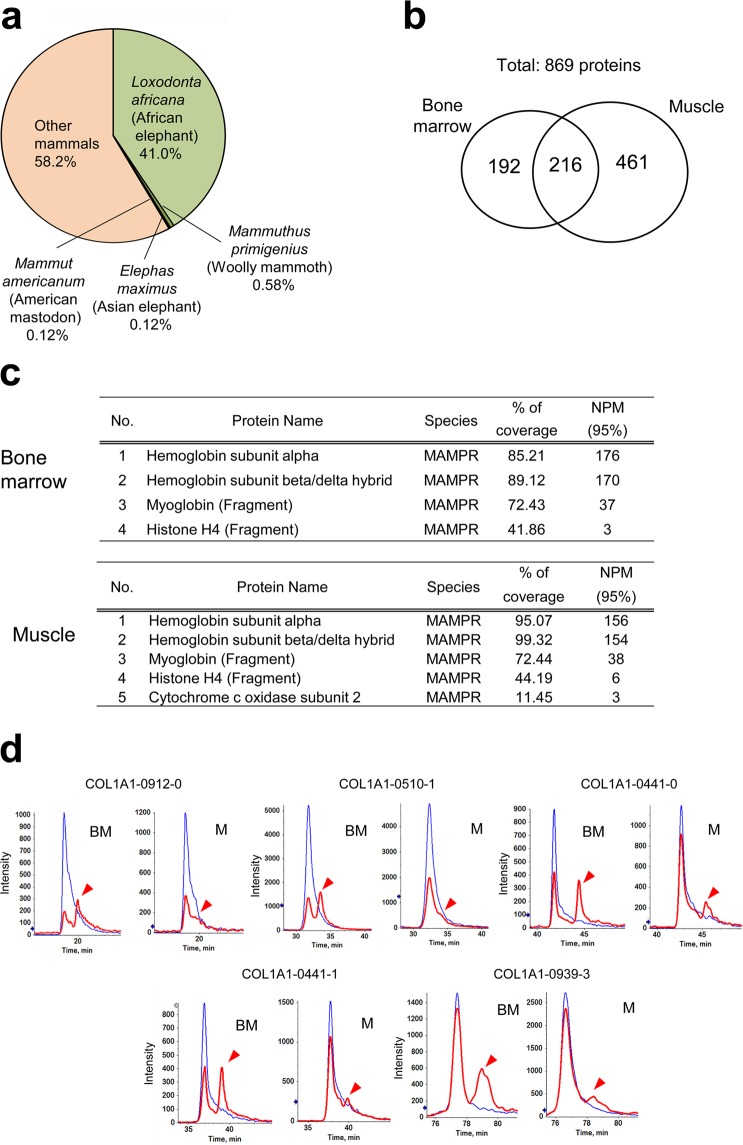
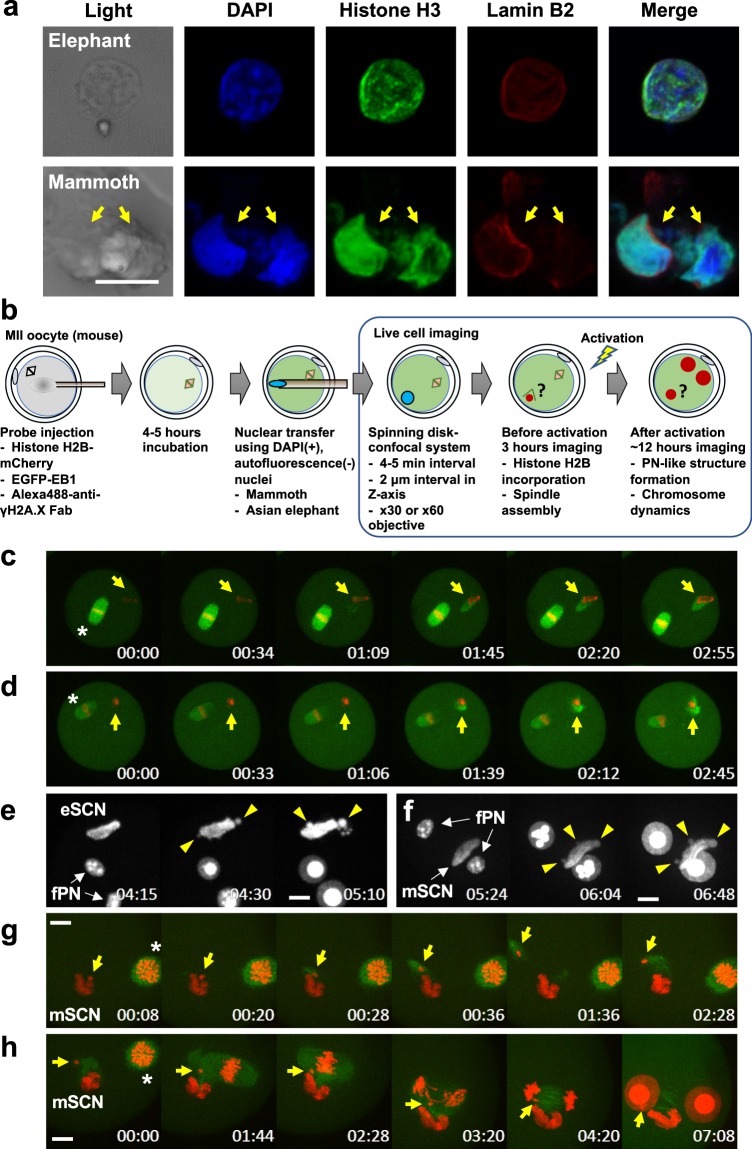
The 28,000-year-old remains of a woolly mammoth, named 'Yuka', were found in Siberian permafrost. Here we recovered the less-damaged nucleus-like structures from the remains and visualised their dynamics in living mouse oocytes after nuclear transfer. Proteomic analyses demonstrated the presence of nuclear components in the remains. Nucleus-like structures found in the tissue homogenate were histone- and lamin-positive by immunostaining. In the reconstructed oocytes, the mammoth nuclei showed the spindle assembly, histone incorporation and partial nuclear formation; however, the full activation of nuclei for cleavage was not confirmed. DNA damage levels, which varied among the nuclei, were comparable to those of frozen-thawed mouse sperm and were reduced in some reconstructed oocytes. Our work provides a platform to evaluate the biological activities of nuclei in extinct animal species.


Conflict of interest statement

The authors declare no competing interests.

Figures

Figure 1
Figure 1
Validation of mammoth sample by whole-genome sequencing. (a) Photograph of the remains of a woolly mammoth, named Yuka. (b) The tree was inferred using the Maximum Likelihood method based on the Tamura-Nei model in MEGA6. The number at the nodes indicates the confidence level greater than 95% with 1,000 bootstrap replicates. The scale bar represents a distance of 0.02 substitution per site. (c) Venn diagrams showing comparison of sequence nucleotide variants (SNVs) between the Yuka mammoth and other elephantid specimens. SNVs identified in at least one of the five elephantid specimens (M4 and M25 woolly mammoths and three Asian elephants) are indicated as five elephantids. (d) Amino acid substitution in mammoth serum albumin and fibrinogen alpha chain are compatible with mammoth SNVs found in our genomic sequencing and previous reports,.
Figure 2
Figure 2
Proteomic analyses of mammoth tissues. (a) More than 40% of the proteins identified by searching against mammalian and mammoth protein databases belong to the order Proboscidea. (b) The Venn diagram represents the proteins identified in the bone marrow and the muscle tissues. (c) The list of the proteins identified by the search against the mammoth protein database. NPM (95%) means the number of peptides matched with confidence of more than 95%. (d) Comparison of the degree of glutamine deamidation in five collagen peptides between the bone marrow (BM) and muscle (M) samples using extracted ion chromatography. Blue and red lines correspond to normal and deamidated forms of the collagen peptides, respectively. Arrowheads indicate peaks of deamidated forms.
Figure 3
Figure 3
Reconstruction of mammoth nuclei upon nuclear transfer to mouse oocytes. (a) Immunostaining of nucleus-like structure from elephant or mammoth tissue with anti-histone H3, anti-lamin B2 and DAPI. (b) Experimental scheme and conditions for NT and imaging. Mouse metaphase II oocytes were injected with mixture of various fluorescent probes, subjected to NT without enucleation of metaphase II chromosomes and imaged. (ch) Time-lapse images of NT oocytes injected with mammoth (d,f,g and h) or elephant (c and e) nuclei at the stages of before (c,d and g) and after (e,f and h) activation. Green and red colours represent EB1 (spindle) and H2B (chromatin), respectively. White colour represents H2B-mCherry signal (e and f). Yellow arrows indicate mammoth or elephant nucleus-like structures (c and d) and the mammoth chromosome that detached from nucleus-like structure and entered into the mouse pronucleus (g and h). Arrowheads indicate the injected mammoth or elephant nucleus forming pronucleus-like structures (nuclear blebs). Asterisks show metaphase II chromosomes. eSCN, mSCN and fPN represent elephant somatic cell nucleus, mammoth somatic cell nucleus and female pronucleus, respectively. The time (h:min) shown in the images indicates time duration from the starting point of imaging. Bar = 10 μm.
Figure 4
Figure 4
Quantification of DSBs of mammoth genome reveals the various degrees of DNA damage. (ac) DSBs in embryos injected with fresh, frozen-thawed once (FT_1) or twenty times (FT_20), DNase-treated sperm. (a) Representative images of γH2A.X (green) and H2B (red) signals of fresh and FT_20 sperm injected into mouse oocytes. Arrows and asterisks indicate sperm nuclei injected and anaphase II chromosomes, respectively. (b) DDIs (γH2A.X/H2B ratio) of FT and DNase-treated sperm were significantly higher than those of fresh sperm (Steel test, P < 0.01). Number of samples analysed are shown in parentheses. (c) Developmental abilities of embryos injected with FT_20 sperm were significantly reduced at the blastocyst stage (Fisher exact test, P < 0.01) but not at the morula stage (P = 0.077). Blastocyst with FT_20 sperm was not detected (n.d.). (d–i) DSBs in mammoth nuclei. Arrows and asterisks indicate mammoth nucleus-like structures injected and metaphase II chromosomes, respectively. The time (h:min) shown in the images indicates time duration from the starting point of imaging. (d and e) Representative time-lapse images of γH2A.X (green) before oocyte activation. (f) DDI of 14 independent mammoth nuclei 3 h after the NT. Magnified images for nuclei that had the highest and lowest levels of DNA breaks are shown. Note that DNA damage were particularly accumulated at the peripheral region of nuclei. (g and h) Representative time-lapse image of γH2A.X after activation. (i) Time course changes in DDI of mammoth genome in seven independent nuclei. Bar = 10 μm.

Comment in

References

    1. Miller W, et al. Sequencing the nuclear genome of the extinct woolly mammoth. Nature. 2008;456:387–390. doi: 10.1038/nature07446. - DOI - PubMed
    1. Palkopoulou E, et al. Complete genomes reveal signatures of demographic and genetic declines in the woolly mammoth. Curr. Biol. 2015;25:1395–1400. doi: 10.1016/j.cub.2015.04.007. - DOI - PMC - PubMed
    1. Poinar HN, et al. Metagenomics to Paleogenomics: Large-scale sequencing of mammoth DNA. Science. 2006;311:392–394. doi: 10.1126/science.1123360. - DOI - PubMed
    1. Campbell KL, et al. Substitutions in woolly mammoth hemoglobin confer biochemical properties adaptive for cold tolerance. Nat. Genet. 2010;42:536–540. doi: 10.1038/ng.574. - DOI - PubMed
    1. Römpler H, et al. Nuclear gene indicates coat-color polymorphism in mammoths. Science. 2006;313:62. doi: 10.1126/science.1128994. - DOI - PubMed

Publication types