. 2019 Mar 11;9(1):4162.
doi: 10.1038/s41598-019-39901-z.

A Mathematical Analysis of Aerobic Glycolysis Triggered by Glucose Uptake in Cones

Affiliations

A Mathematical Analysis of Aerobic Glycolysis Triggered by Glucose Uptake in Cones

Erika T Camacho et al. Sci Rep. .

Abstract

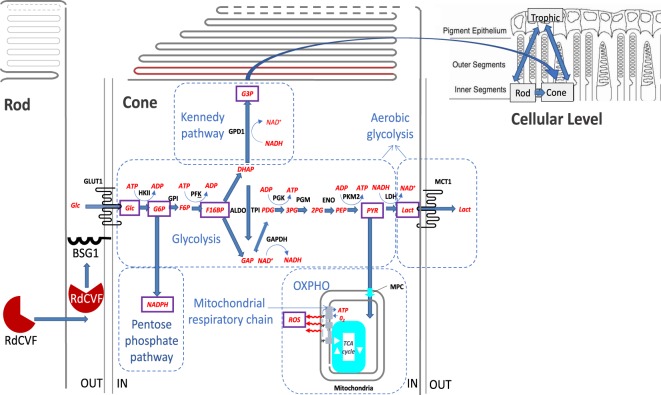
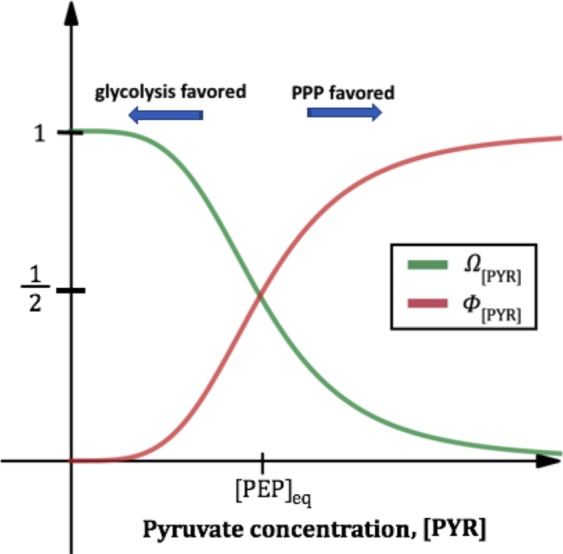
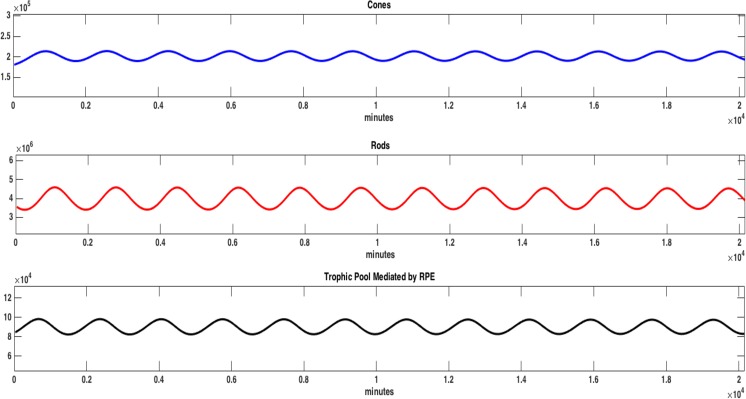
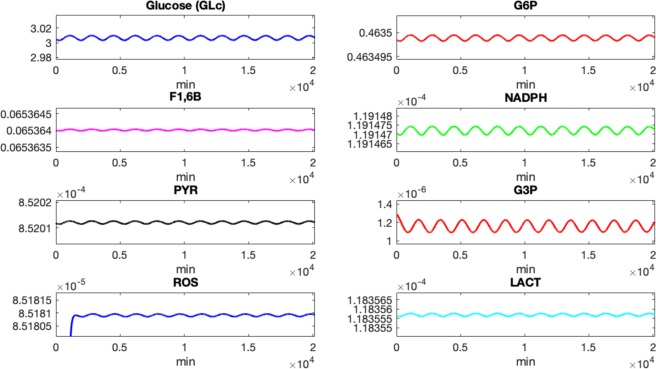
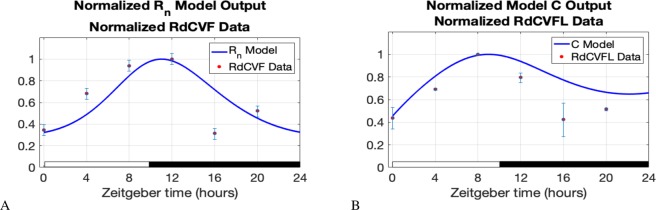
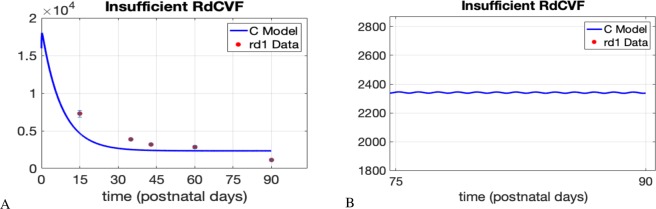
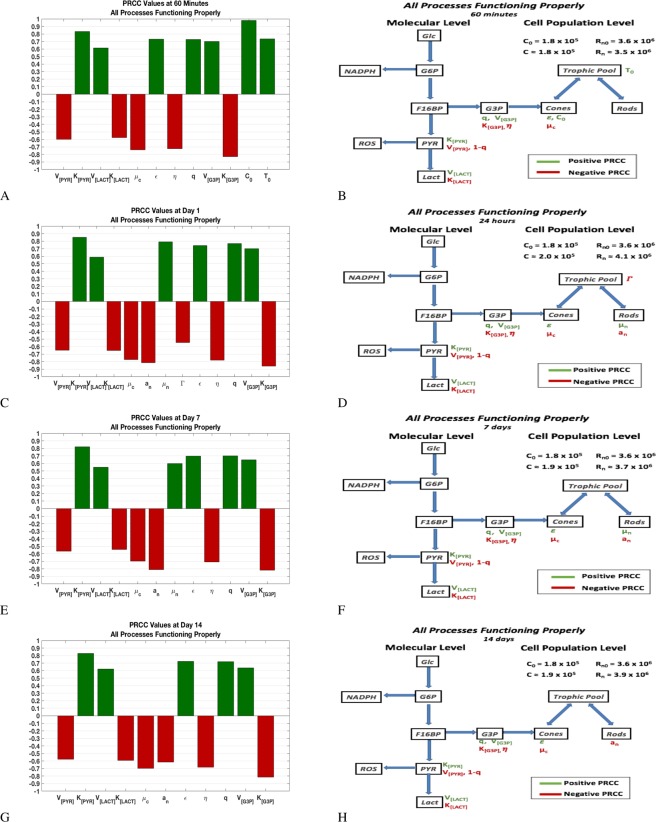
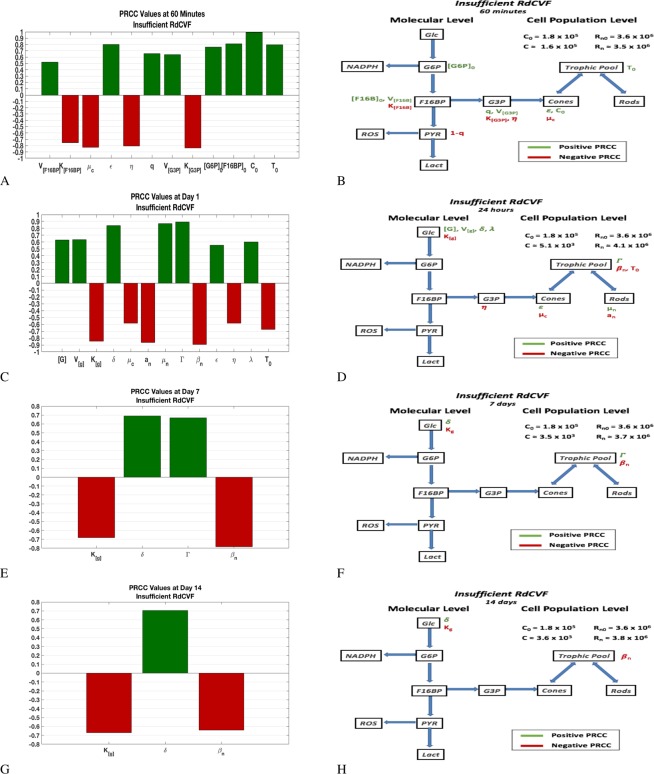
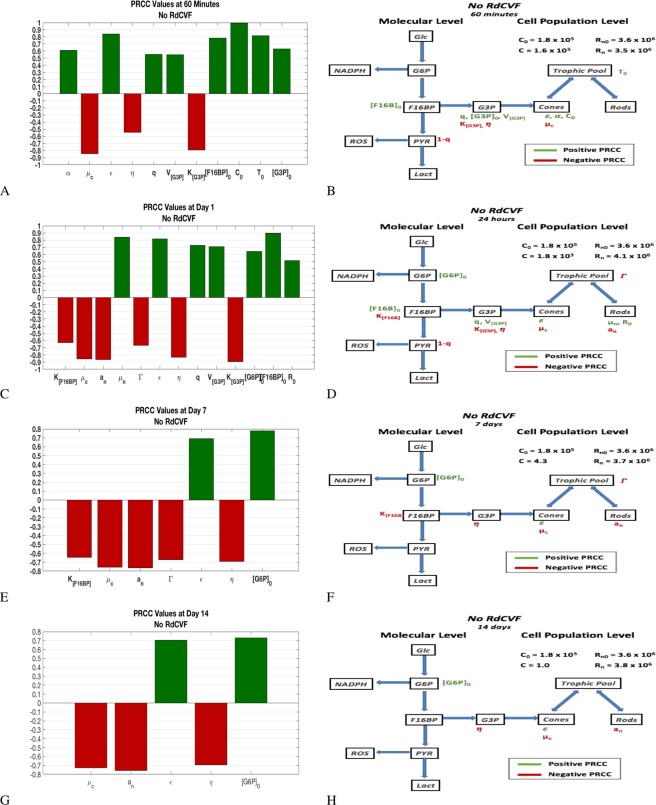
Patients affected by retinitis pigmentosa, an inherited retinal disease, experience a decline in vision due to photoreceptor degeneration leading to irreversible blindness. Rod-derived cone viability factor (RdCVF) is the most promising mutation-independent treatment today. To identify pathologic processes leading to secondary cone photoreceptor dysfunction triggering central vision loss of these patients, we model the stimulation by RdCVF of glucose uptake in cones and glucose metabolism by aerobic glycolysis. We develop a nonlinear system of enzymatic functions and differential equations to mathematically model molecular and cellular interactions in a cone. We use uncertainty and sensitivity analysis to identify processes that have the largest effect on the system and their timeframes. We consider the case of a healthy cone, a cone with low levels of glucose, and a cone with low and no RdCVF. The three key processes identified are metabolism of fructose-1,6-bisphosphate, production of glycerol-3-phosphate and competition that rods exert on cone resources. The first two processes are proportional to the partition of the carbon flux between glycolysis and the pentose phosphate pathway or the Kennedy pathway, respectively. The last process is the rods' competition for glucose, which may explain why rods also provide the RdCVF signal to compensate.


Conflict of interest statement

The authors declare no competing interests.

Figures

Figure 1
Figure 1
Molecular steps modeled in aerobic glycolysis. The biochemical quantities we model in the system are boxed in or circled. This picture has been modified from,.
Figure 2
Figure 2
The rerouting of glucose is not an ON/OFF switch but rather a tuning switch as depicted by the graphs of Ω[PYR]=[PEP]eq4[PEP]eq4+[PYR]4 and Φ[PYR]=[PYR]4[PEP]eq4+[PYR]4.
Figure 3
Figure 3
Plot of C, Rn, and T vs. time (in minutes) when all processes are functioning properly for 20,160 minutes (14 days). The parameters used for the simulation are those listed in Table 2. The ratio of rods to cones is about 20:1, with C(20,160) = 1.93 × 105.
Figure 4
Figure 4
Plot of concentrations of various biochemical quantities (in mM) vs. time (in minutes) that arise in aerobic glycolysis, PPP, and OXPHO. The parameters used for the simulation are those listed in Table 2. Simulations are from time t=0 minutes to t = 20,160 minutes (which is 14 days).
Figure 5
Figure 5
We normalized RdCVF expression data by dividing by the largest RdCVF value. In a similar manner, we normalized the RdCVFL expression data. We also normalized the model output values for C and Rn by dividing by the model’s maximum C and Rn values, respectively, on the time interval from 0 minutes to 1,440 minutes (24 hours). We let Rn(0) = 2,088,000 and C(0) = 7,380 in the model so that the initial normalized data and normalized model output values are the same. All other parameter values are the same as they appear in Table 2. RdCVF and RdCVFL expression data was collected at 0, 4, 8, 12, 16, and 20 hours on Zeitgeber time; see Fig. 10 in Supplemental Material A.3.
Figure 6
Figure 6
Model validation with rd1 cone density data. The cone density data represents cone cell count per mm2. In, each square millimeter is referred to as a field. There are approximately 300 fields with surface area 0.0376 mm2. Our mathematical model produces values for C throughout the retina instead of within a particular surface area. Thus, we divide the model output, C, by (300 · 0.0376). The data points in the plots correspond to the mean cone densities at postnatal days 15, 35, 43, 60, and 90. In the model simulation we consider a time span of t0 = 0 minutes to tf = 12.96 × 104 minutes (90 days), δ = 30 × 10−9 and μc = 0.09 × 10−3. All other parameter values are the same as in Table 2. In (B), the image is zoomed in to show the presence of small oscillations even around the 90 day time point.
Figure 7
Figure 7
PRCC plots and corresponding effects for a retina in which all processes are functioning properly. The left panels give the partial rank correlation coefficient (PRCC) plots for parameters with significant PRCC values while the right panels give the location of those parameters in the flow diagram. The value of C and Rn at the given time snapshot are given in the right panels. The PRCC values are given in Table 15 (in Supplemental Information). See Sections 4.2 and 2.5 for details on PRCC analysis.
Figure 8
Figure 8
PRCC plots and corresponding effect on flow diagram for low levels of RdCVF. The two top panels, (A and B) are for 1 hour, the next two panels, (B and D), for 1 day, the next two panels, (E and F), for 7 days, and the two bottom panels, (G and H), are for 14 days. The left panels give the partial rank correlation coefficient (PRCC) plots for parameters with significant PRCC values while the right panels give the location of parameters with significant PRCC values in the flow diagram. The value of C is significantly lower compared to the healthy eye but levels off to a reduced value. The value of C and Rn at every time snapshot is given in each of the figures in the right panel. The PRCC values are given in Supplemental Information Table 17. See Sections 4.2 and 2.5 for details on PRCC analysis.
Figure 9
Figure 9
PRCC plots and corresponding effect on flow diagram in the absence of RdCVF. The two top panels, (A and B) are for 1 hour, the next two panels, (B and D), for 1 day, the next two panels, (E and F), for 7 days, and the two bottom panels, (G and H), are for 14 days. The left panels give the partial rank correlation coefficient (PRCC) plots for parameters with significant PRCC values while the right panels give the location of the significant PRCC quantity in the flow diagram. The value of C and Rn at the given time snapshot are given in each of the figures in the right panel and C is basically non-existent by day 7 in this scenario. The PRCC values are given in Table 18 (in Supplemental Information). See Sections 4.2 and 2.5 for details on PRCC analysis.

References

    1. Wong-Riley M. Energy metabolism of the visual system. Eye and Brain. 2010;2:99. - PMC - PubMed
    1. Young R. The renewal of photoreceptor cell outer segments. J. Cell Biol. 1967;33:61–72. - PMC - PubMed
    1. O’Day W, Young R. Rhythmic daily shedding of outer-segment membranes by visual cells in the goldfish. J. Cell Biol. 1978;76:593–604. - PMC - PubMed
    1. Zhang Y, Chioreso C, Schweizer ML, Abramoff MD. Effects of aflibercept for neovascular age-related macular degeneration: a systematic review and meta-analysis of observational comparative studies. Invest. Ophth. Vis. Sci. 2017;58:5616–5627. - PMC - PubMed
    1. Camacho ET, Melara LA, Villalobos MC, Wirkus S. Optimal control in the treatment of retinitis pigmentosa. B. Math. Biol. 2014;76:292–313. - PubMed

Publication types