. 2019 Mar 11;9(1):4120.
doi: 10.1038/s41598-019-40868-0.

Early life stress delays hippocampal development and diminishes the adult stem cell pool in mice

Affiliations

Early life stress delays hippocampal development and diminishes the adult stem cell pool in mice

Mary Youssef et al. Sci Rep. .

Abstract

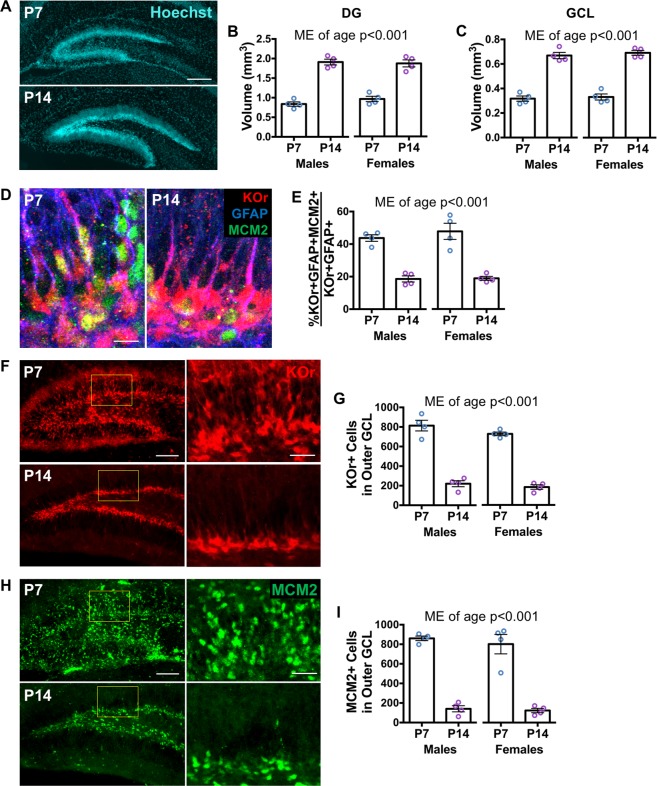
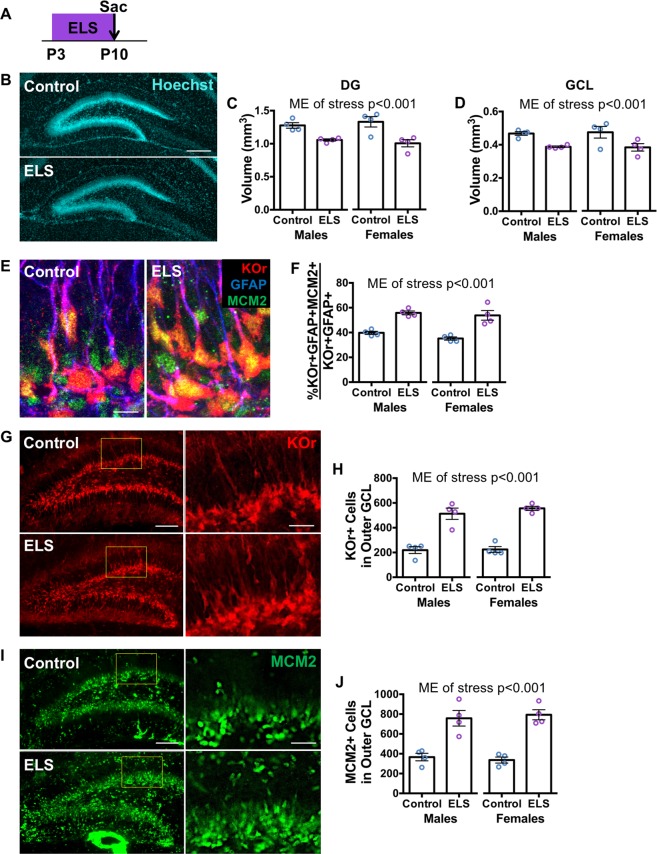
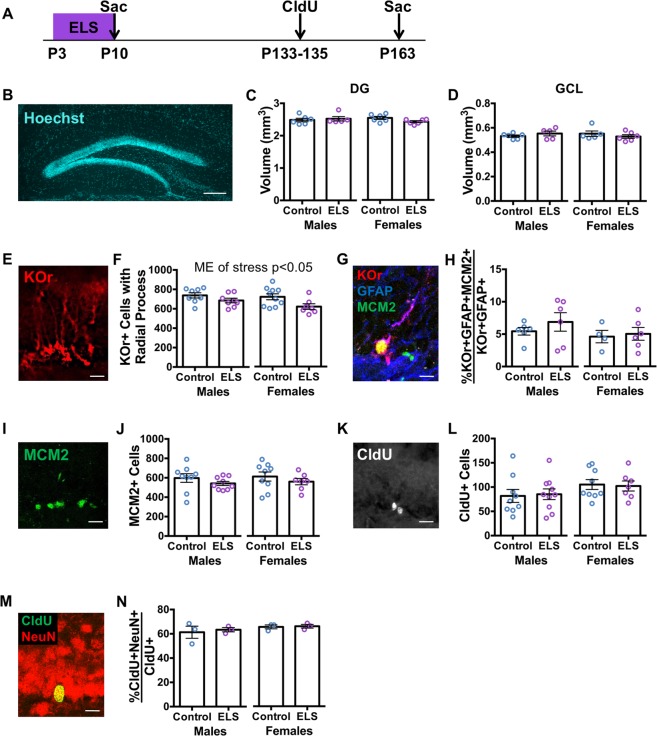
Early life stress predisposes to mental illness and behavioral dysfunction in adulthood, but the mechanisms underlying these persistent effects are poorly understood. Stress throughout life impairs the structure and function of the hippocampus, a brain system undergoing considerable development in early life. The long-term behavioral consequences of early life stress may therefore be due in part to interference with hippocampal development, in particular with assembly of the dentate gyrus (DG) region of the hippocampus. We investigated how early life stress produces long-term alterations in DG structure by examining DG assembly and the generation of a stable adult stem cell pool in routine housing and after stress induced by the limited bedding/nesting paradigm in mice. We found that early life stress leads to a more immature, proliferative DG than would be expected for the animal's age immediately after stress exposure, suggesting that early life stress delays DG development. Adult animals exposed to early life stress exhibited a reduction in the number of DG stem cells, but unchanged neurogenesis suggesting a depletion of the stem cell pool with compensation in the birth and survival of adult-born neurons. These results suggest a developmental mechanism by which early life stress can induce long-term changes in hippocampal function by interfering with DG assembly and ultimately diminishing the adult stem cell pool.


Conflict of interest statement

The authors declare no competing interests.

Figures

Figure 1
Figure 1
Dentate gyrus grows and consolidates during the first two postnatal weeks. (A) Representative images of Hoechst staining of the dentate gyrus (DG) at P7 and P14 (scale bar: 200 μm). (B) The volume of the DG is greater at P14 compared to at P7 (age: F(1,12) = 186.9, p < 0.0001; sex: F(1,12) = 0.2653, p = 0.6158; age x sex: F(1,12) = 1.296, p = 0.2771). (C) The volume of the granule cell layer (GCL) is also greater at P14 compared to at P7 (age: F(1,12) = 239.3, p < 0.0001; sex: F(1,12) = 0.7126, p = 0.4151; age x sex: F(1,12) = 0.0480, p = 0.8303). (D) Representative images of KOr+ GFAP + MCM2+ dividing neural stem cells at P7 and P14 (scale bar: 10 μm). (E) A smaller percentage of KOr+ GFAP+ radial stem cells express cell division marker MCM2 at P14 compared to at P7 (age: F(1,12) = 86.91, p < 0.0001; sex: F(1,12) = 0.5017, p = 0.4923; age x sex: F(1,12) = 0.3985, p = 0.5397). (F) Representative images of KOr+ stem and progenitor cells including high magnification images of outlined areas at P7 and P14 (scale bars: 100 μm for low magnification and 30 μm for high magnification). (G) There are fewer KOr+ stem and progenitor cells in the outer third of the GCL at P14 compared to at P7 (age: F(1,12) = 272.6, p < 0.0001; sex: F(1,12) = 3.076, p = 0.1049; age x sex: F(1,12) = 0.5044, p = 0.4911). (H) Representative images of MCM2+ dividing cells including high magnification images of outlined areas at P7 and P14 (scale bars: 100 μm for magnification and 30 μm for high magnification). (I) There are fewer MCM2 + dividing cells in the outer third of the GCL at P14 compared to at P7 (age: F(1,12) = 164.5, p < 0.0001; sex: F(1,12) = 0.4760, p = 0.5034; age x sex: F(1,12) = 0.1396, p = 0.7152). Data are expressed as mean ± SEM. Main effect (ME) of age is noted when statistically significant (p < 0.05).
Figure 2
Figure 2
Early life stress results in an immature dentate gyrus immediately after stress exposure. (A) Experimental timeline denoting early life stress (ELS) from P3–P10, followed by sacrifice on P10 of Nestin-KOr animals. (B) Representative images of Hoechst staining of the DG in unstressed control and ELS mice (scale bar: 200 μm). (C) The volume of the DG is smaller in ELS animals compared to unstressed controls (stress: F(1,12) = 26.56, p = 0.0002; sex: F(1,12) = 0.0005, p = 0.9823; stress x sex: F(1,12) = 1.017, p = 0.3332). (D) The volume of the GCL is also smaller in ELS animals compared to unstressed controls (stress: F(1,12) = 15.74, p = 0.0019; sex: F(1,12) = 0.00006, p = 0.9937; stress x sex: F(1,12) = 0.0645, p = 0.8038). (E) Representative images of KOr + GFAP + MCM2+ dividing stem cells in unstressed control and ELS mice (scale bar: 10 μm). (F) A larger percentage of KOr + GFAP+ radial stem cells express cell division marker MCM2 in ELS animals compared to unstressed controls (stress: F(1,12) = 58.83, p < 0.0001; sex: F(1,12) = 1.856, p = 0.1981; stress x sex: F(1,12) = 0.3296, p = 0.576). (G) Representative images of KOr+ stem and progenitor cells in unstressed control and ELS mice including high magnification images of outlined areas (scale bars: 100 μm for low magnification and 30 μm for high magnification). (H) There are more KOr+ stem and progenitor cells in the outer third of the GCL in ELS animals compared to unstressed controls (stress: F(1,12) = 106.2, p < 0.0001; sex: F(1,12) = 0.5819, p = 0.4603; stress x sex: F(1,12) = 0.3877, p = 0.5452). Representative images of MCM2+ dividing cells in unstressed control and ELS mice including high magnification images of outlined areas (scale bars: 100 μm for low magnification and 30 μm for high magnification). (J) There are more MCM2+ dividing cells in the outer third of the GCL in ELS animals compared to unstressed controls (stress: F(1,12) = 64.99, p < 0.0001; sex: F(1,12) = 0.0003, p = 0.9870; stress x sex: F(1,12) = 0.3791, p = 0.5496). Data are expressed as mean ± SEM. ME of stress is noted when statistically significant (p < 0.05).
Figure 3
Figure 3
Early life stress leads to a diminished stem cell pool without altering cell proliferation and neurogenesis in young adult mice. (A) Experimental timeline of ELS from P3–P10, followed by chlorodeoxyuridine (CldU) administration from P133 to P135 and sacrifice on P163 of Nestin-KOr animals. (B) Representative image of Hoechst staining of the DG (scale bar: 200 μm). (C) No difference is detected in the volume of the DG between unstressed control and ELS animals at P163 (stress: F(1,19) = 0.6018, p = 0.4474; sex: F(1,19) = 0.3521, p = 0.5599; stress x sex: F(1,19) = 2.258, p = 0.1494). (D) No difference is detected in the volume of the GCL between unstressed control and ELS animals (stress: F(1,18) = 0.0034, p = 0.9545; sex: F(1,18) = 0.0074, p = 0.9326; stress x sex: F(1,18) = 1.769, p = 0.2001). (E) Representative image of KOr+ radial stem cells (scale bar: 20 μm). (F) There are fewer KOr+ radial stem cells in the DG of ELS animals compared to unstressed controls at P163 (stress: F(1,29) = 7.351, p = 0.0111; sex: F(1,29) = 2.391, p = 0.1329; stress x sex: F(1,29) = 0.7132, p = 0.4053). (G) Representative image of KOr + GFAP + MCM2+ radial stem cell (scale bar: 10 μm). (H) No difference is detected in the percentage of KOr + GFAP+ radial stem cells expressing cell division marker MCM2 between unstressed control and ELS animals (stress: F(1,18) = 0.7519, p = 0.3973; sex: F(1,18) = 1.509, p = 0.2350; stress x sex: F(1,18) = 0.2200, p = 0.6447). (I) Representative image of MCM2+ dividing cells (scale bar: 20 μm). (J) No difference is detected in the number of MCM2+ dividing cells in the DG between unstressed control and ELS animals (stress: F(1,30) = 1.975, p = 0.1701; sex: F(1,30) = 0.1582, p = 0.6937; stress x sex: F(1,30) = 0.0017, p = 0.9679). (K) Representative image of CldU+ newborn cells (scale bar: 20 μm). (L) No difference is detected in the number of CldU+ newborn cells in the DG between unstressed control and ELS animals (stress: F(1,31) = 0.0007, p = 0.9797; sex: F(1,31) = 3.085, p = 0.0889; stress x sex: F(1,31) = 0.0785, p = 0.7813). (M) Representative image of CldU + NeuN+ mature neuron (scale bar: 10 μm). (N) No difference is detected in the percentage of CldU+ cells expressing mature neuron marker NeuN between unstressed control and ELS animals (stress: F(1,8) = 0.2103, p = 0.6587; sex: F(1,8) = 1.440, p = 0.2644; stress × sex: F(1,8) = 0.0775, p = 0.7877). Data are expressed as mean ± SEM. ME of stress is noted when statistically significant (p < 0.05).

Similar articles

Cited by

References

    1. Heim C, Nemeroff CB. The role of childhood trauma in the neurobiology of mood and anxiety disorders: preclinical and clinical studies. Biol Psychiatry. 2001;49:1023–1039. doi: 10.1016/S0006-3223(01)01157-X. - DOI - PubMed
    1. de Kloet ER, Sibug RM, Helmerhorst FM, Schmidt MV. Stress, genes and the mechanism of programming the brain for later life. Neurosci Biobehav Rev. 2005;29:271–281. doi: 10.1016/j.neubiorev.2004.10.008. - DOI - PubMed
    1. Green JG, et al. Childhood adversities and adult psychiatric disorders in the national comorbidity survey replication I: associations with first onset of DSM-IV disorders. Arch Gen Psychiatry. 2010;67:113–123. doi: 10.1001/archgenpsychiatry.2009.186. - DOI - PMC - PubMed
    1. Huot RL, Plotsky PM, Lenox RH, McNamara RK. Neonatal maternal separation reduces hippocampal mossy fiber density in adult Long Evans rats. Brain Res. 2002;950:52–63. doi: 10.1016/S0006-8993(02)02985-2. - DOI - PubMed
    1. Naninck EF, et al. Chronic early life stress alters developmental and adult neurogenesis and impairs cognitive function in mice. Hippocampus. 2015;25:309–328. doi: 10.1002/hipo.22374. - DOI - PubMed

Publication types