. 2019 Mar 11;9(1):4044.
doi: 10.1038/s41598-019-40622-6.

TouchScreen-based phenotyping: altered stimulus/reward association and lower perseveration to gain a reward in mu opioid receptor knockout mice

Affiliations

TouchScreen-based phenotyping: altered stimulus/reward association and lower perseveration to gain a reward in mu opioid receptor knockout mice

Laura-Joy Boulos et al. Sci Rep. .

Abstract

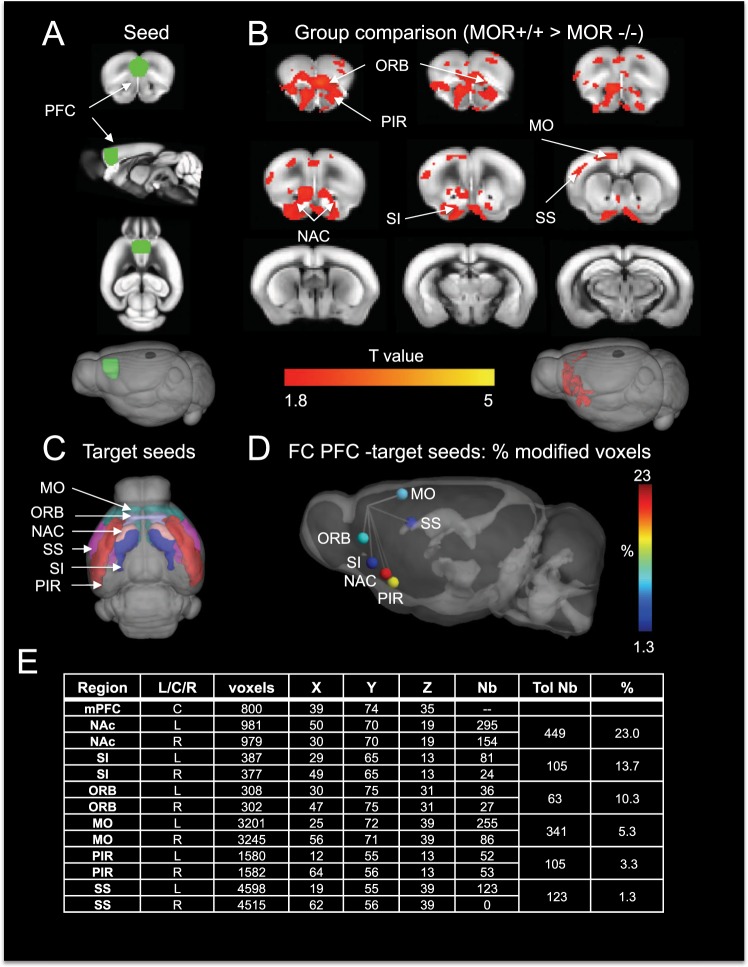
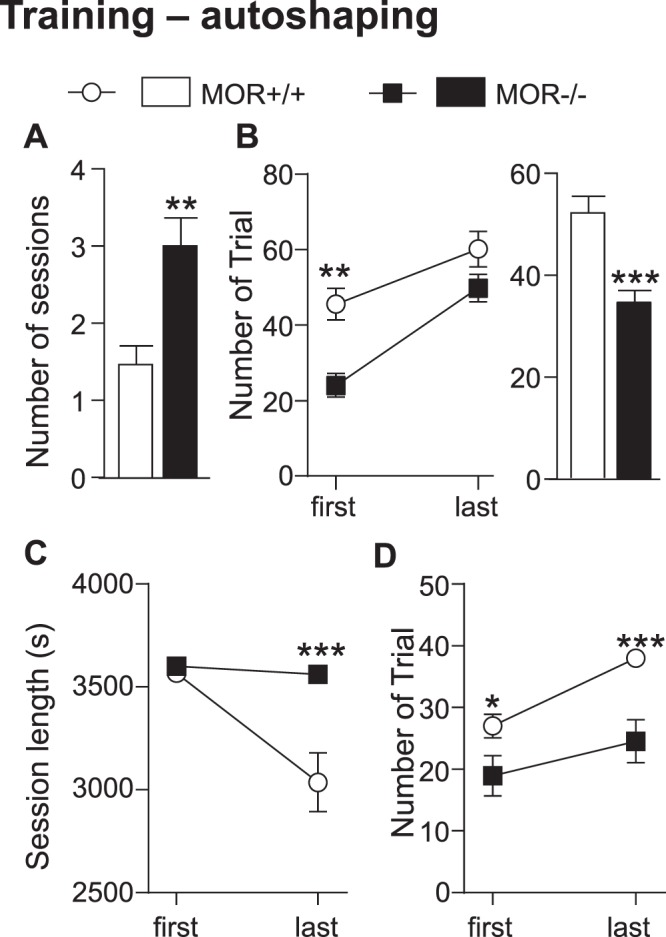
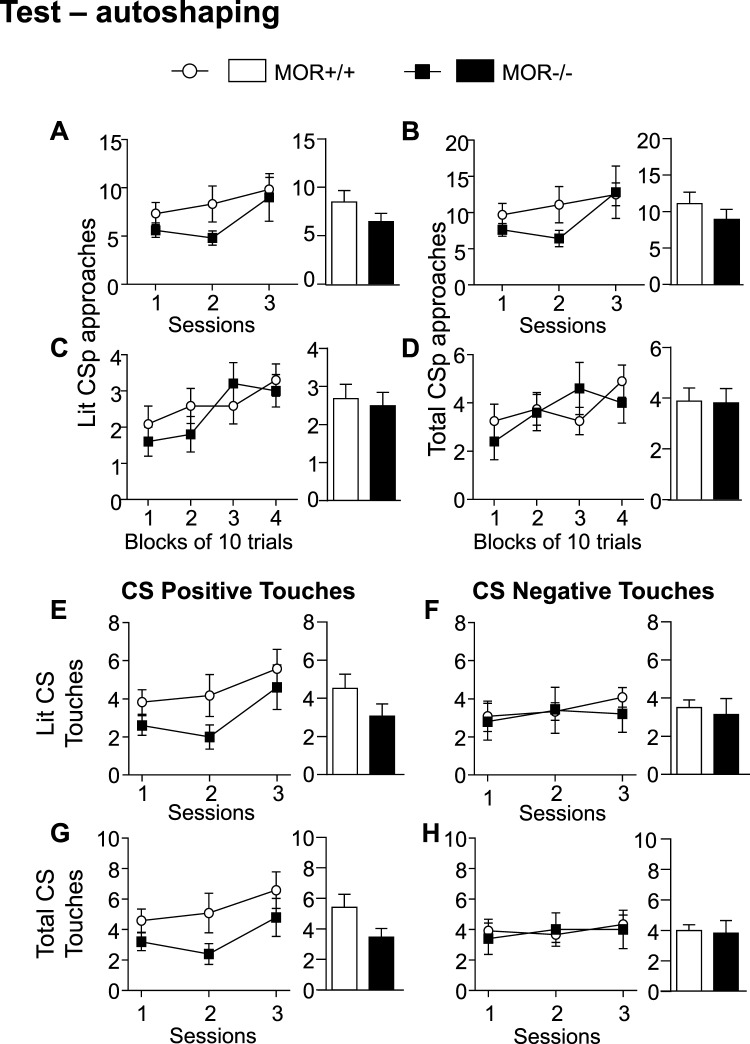
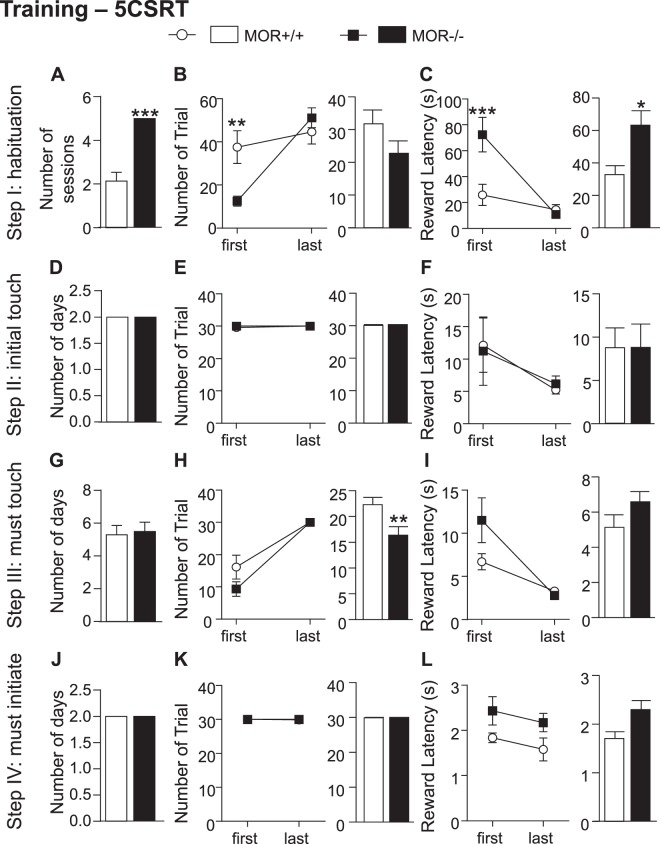
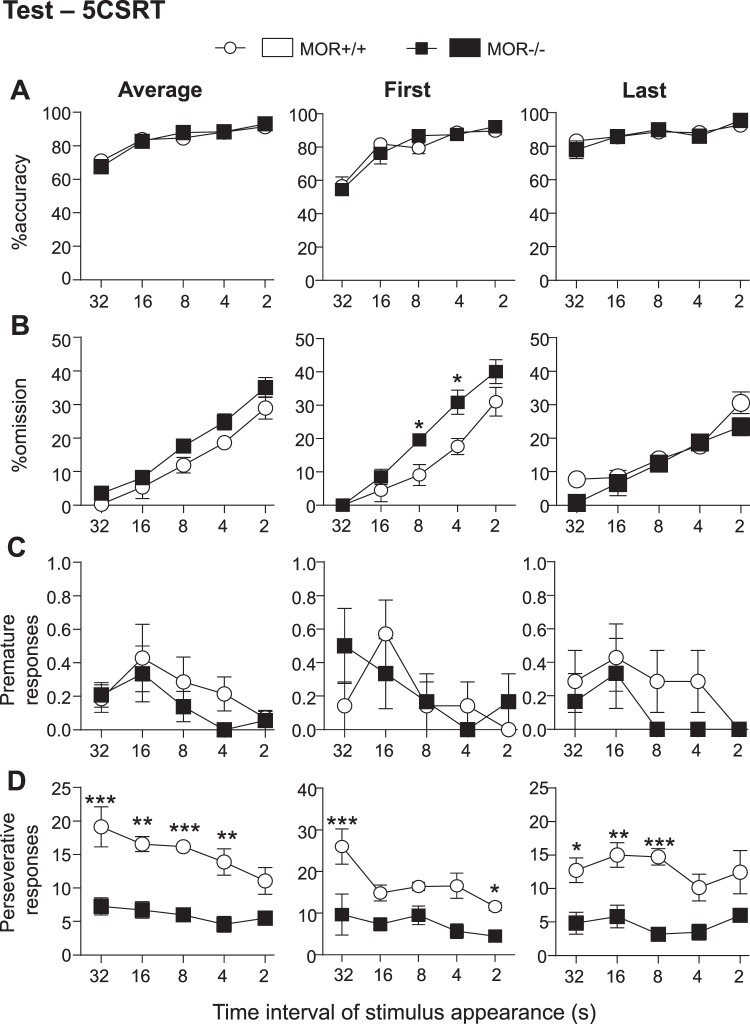
While the contribution of Mu Opioid Receptors (MORs) to hedonic aspects of reward processing is well-established, the notion that these receptors may also regulate motivation to gain a reward, and possibly other related cognitive dimensions, has been less investigated. The prefrontal cortex (PFC) is a critical site for these processes. Our previous functional magnetic resonance imaging study found alterations of functional connectivity (FC) in reward/aversion networks in MOR knockout mice. Here we pursued voxelwise seed-based FC analyses using the same dataset with a focus on the PFC. We observed significant reduction of PFC FC in mutant mice, predominantly with the nucleus accumbens, supporting the notion of altered reward-driven top-down controls. We tested motivation for palatable food in a classical operant self-administration paradigm, and found delayed performance for mutant mice. We then evaluated motivational and cognitive abilities of MOR knockout mice in TouchScreen-based behavioral tests. Learning was delayed and stimulus/reward association was impaired, suggesting lower hedonic reward value and reduced motivation. Perseverative responses were decreased, while discriminatory behavior and attention were unchanged, indicative of increased inhibitory controls with otherwise intact cognitive performance. Together, our data suggest that MORs contribute to enhance reward-seeking and facilitate perseverative behaviors. The possibility that MOR blockade could reduce maladaptive compulsivity deserves further investigation in addiction and self-control disorder research.


Conflict of interest statement

The authors declare no competing interests.

Figures

Figure 1
Figure 1
Seed-based analysis of Rs-fMRI data from MOR knockout mice reveals lower PFC connectivity with several brain regions, with a major effect for PFC-NAc. (A) Localization of the PFC seed (green) in 2D (3 top panels) and 3D (bottom panel) overlaid on the Allen Mouse Brain Connectivity Atlas. (B) Group comparison T values by one tail t-test (T > 1.8, cc = 0.05, n = 13/group, FWER corrected) shows voxels with higher functional connectivity in MOR+/+ compared to MOR−/− groups. The color bar indicates the corresponding significant T-value scaling. (C) Localization of the six identified target seeds for quantitative analysis in 3D representation overlaid on the Allen Mouse Brain Connectivity Atlas. (D) Schematic representation of the six seed regions, color-scaled to indicate the percent voxels showing significant changes (from Table in E). (E) Table showing regions with highest to lowest FC modifications with the PFC seed. Columns from left to right show: the region name (Region), laterality (Left, L; Centre, C; Right, R), the total number of voxels per region (voxels), coordinates of the region (X,Y,Z), the number of voxels showing significant changes across genotypes (Nb) and the resulting total number per region (Tol Nb), and the percent voxels (%) with significant changes across genotypes within the region. MO, somatomotor areas; NAc, nucleus accumbens; ORB, orbitofrontal cortex; PIR, piriform area; SI, substantia innominate; SS, somatosensory cortex. Brain section figures are modified from Allen Mouse Brain Connectivity Atlas API. Available from: http://mouse.brain-map.org/experiment/thumbnails/100048576?image_type=atlas.
Figure 2
Figure 2
MOR−/− mice show impaired acquisition of stimulus-reward association in the autoshaping task. Mice were tested in the TouchScreen autoshaping paradigm composed of a training and a testing phase. AB. Training phase. The average number of sessions is higher (A), the average number of trials per session for first and last session (B left panel) and the average number of trials per session across all the training sessions (B right panel) are lower in mutant mice. CD. Testing phase. Session length (C) is reduced during the last session of this phase in control animals but not in MOR−/− and number of trials (D) is diminished in MOR−/− during the first and last session compared to MOR+/+ mice. Data are expressed as mean ± s.e.m. N = 10–13, *p < 0.05; **p < 0.01; ***p < 0.001. Detailed statistics are shown Supplementary Table S2.
Figure 3
Figure 3
MOR−/− mice show no alteration of discriminatory behavior in the autoshaping task. MOR−/− and their corresponding control animals that reached criterion (40 trials per session) during the autoshaping test phase exhibited comparable discriminatory behavior i.e. increased behavior towards CSp while CSn touches and approaches were stabilized. I.AB. Evolution (A and B left panels) and average (A and B right panels) of lit CSp (A) and total CSp (B) approaches across sessions were similar for both genotypes. Evolution and average of all CSp approaches were also similar across sessions (see Supplementary Fig. S3A). I.CD. Evolution (C and D left panels) and average (C and D right panels) of lit CSp (C) and total CSp (D) approaches across 10-trial blocks during the first session were similar for both genotypes. Evolution and average of all CSp approaches were also similar across 10-trial blocks (see Supplementary Fig. S3C). II.AB. Evolution (A and B left panels) and average (A and B right panels) of lit CSp (A) and CSn (B) touches across sessions were similar for both genotypes. Evolution and average of all CSp and all CSn touches were also similar across sessions (see Supplementary Fig. S3B and D). II.CD. Evolution (C and D left panels) and average (C and D Right panels) of lit CSp (C) and CSn (D) approaches across 10-trial blocks during the first session were similar for both genotypes. Data are expressed as mean ± s.e.m. N = 5–12. Detailed statistics are shown in Supplementary Table S3.
Figure 4
Figure 4
Learning is delayed and reward value is decreased for MOR−/− mice in the 5-Choice Serial Reaction Time task (5-CSRT). MOR−/− showed impaired acquisition of stimulus-reward association during the habituation part of the training phase. Step I. (A) Average of number of sessions to reach criterion is higher in mutant mice. (B) Number of trials per session is reduced in MOR−/− during the first session (left panel). No difference observed between both genotypes on number of trials during last session and on the average of trials (right panel) per session across all sessions. (C) Reward latency for first session (left panel) is reduced in MOR−/− mice leading to a decrease in the average of reward latency per session across all step I sessions (right panel). Step II-IV. DGJ. Average of number of sessions is similar for MOR−/− and control animals for Initial touch (D), Must touch (G) and Must initiate (J). EHK. Number of trials per session for first and last session (left panels) as well as average of trials per session across all sessions (right panels) of Initial touch (E), Must touch (H) and Must initiate (K) phases are not altered in mutant mice. Evolution of number of trials per session for each mouse during the Must Touch phase is shown in (B) FIL. Reward latency for the first and last session (left panels) in addition to average of reward latency per session across (right panels) of Initial touch (F), Must touch (I) and Must initiate (L) phases are not altered in mutant mice. Overall the total number of sessions to reach criterion during training phases and move to test is significantly higher in MOR−/− (See Supplementary Fig. S4A,B). Data are expressed as mean ± s.e.m. N = 7–8, *p < 0.05; **p < 0.01; ***p < 0.001. Detailed statistics are shown Supplementary Table S4.
Figure 5
Figure 5
MOR−/− mice show intact attention but lower motivation and perseveration in a 5-CSRT test. MOR−/− mice showed a preserved attention processes and significantly reduced compulsive-like behavior in the 5-CSRT task. (A) % of accuracy across different intervals of stimulus is similar for both genotypes. Data represent average of % of accuracy for all, first and last sessions for each interval. (B) MOR−/− mice show an increase of % omission in the first session of each interval compared to control mice and this effect disappear during the last session of every phase. Data represent average of % omission for all, first and last sessions for each interval. (C) No difference between MOR−/− and their control mice on the number of premature responses. Data represent the average of the number of premature response during all, first and last sessions for each interval. (D) MOR−/− mice showed a drastic decrease of perseverative responses in comparison to MOR+/+ animals. Data represent the average of the number of perseverative response during all, first and last sessions for each interval. In addition, the evolution of both front and back beam breaks across different intervals of stimulus appearance was similar in both genotypes (see Supplementary Fig. S5A,B). Overall, number of sessions per interval to reach criteria as well as average number of sessions to finish the 5-CSRT test was similar across genotypes (see Supplementary Fig. S5C,D). Data are expressed as mean ± s.e.m. N = 7–8, *p < 0.05; **p < 0.01; ***p < 0.001. Detailed statistics are shown in Supplementary Table S5.

References

    1. Waldhoer M, Bartlett SE, Whistler JL. Opioid receptors. Annual review of biochemistry. 2004;73:953–990. doi: 10.1146/annurev.biochem.73.011303.073940. - DOI - PubMed
    1. Lutz PE, Kieffer BL. The multiple facets of opioid receptor function: implications for addiction. Current opinion in neurobiology. 2013;23:473–479. doi: 10.1016/j.conb.2013.02.005. - DOI - PMC - PubMed
    1. Moles A, Kieffer BL, D’Amato FR. Deficit in attachment behavior in mice lacking the mu-opioid receptor gene. Science. 2004;304:1983–1986. doi: 10.1126/science.1095943. - DOI - PubMed
    1. Contet C, Kieffer BL, Befort K. Mu opioid receptor: a gateway to drug addiction. Current opinion in neurobiology. 2004;14:370–378. doi: 10.1016/j.conb.2004.05.005. - DOI - PubMed
    1. Charbogne P, Kieffer BL, Befort K. 15 years of genetic approaches in vivo for addiction research: Opioid receptor and peptide gene knockout in mouse models of drug abuse. Neuropharmacology. 2014;76 Pt B:204–217. doi: 10.1016/j.neuropharm.2013.08.028. - DOI - PMC - PubMed

Publication types

Substances