

Low Electric Treatment activates Rho GTPase via Heat Shock Protein 90 and Protein Kinase C for Intracellular Delivery of siRNA
- PMID: 30858501
- PMCID: PMC6412017
- DOI: 10.1038/s41598-019-40904-z
Low Electric Treatment activates Rho GTPase via Heat Shock Protein 90 and Protein Kinase C for Intracellular Delivery of siRNA
Abstract
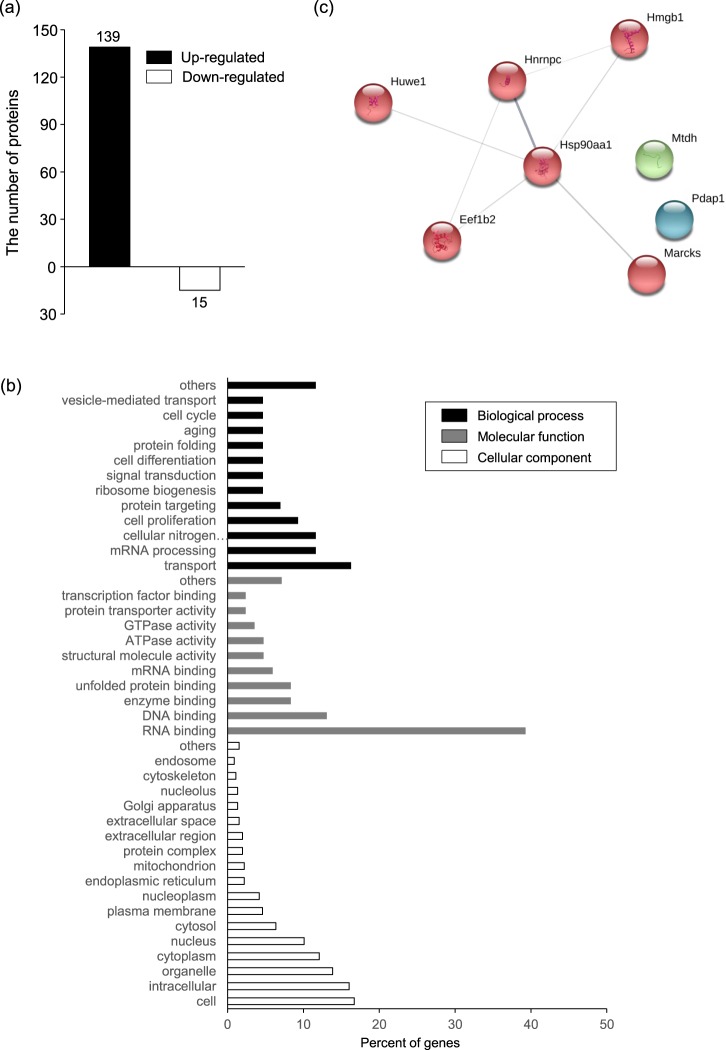
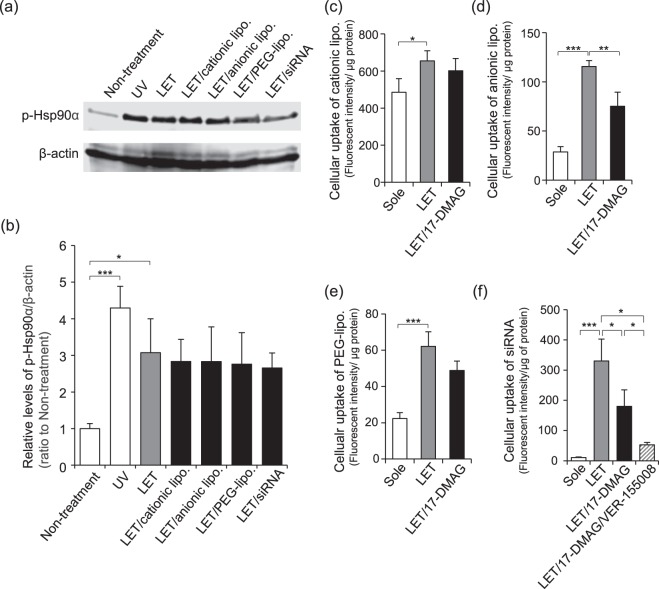
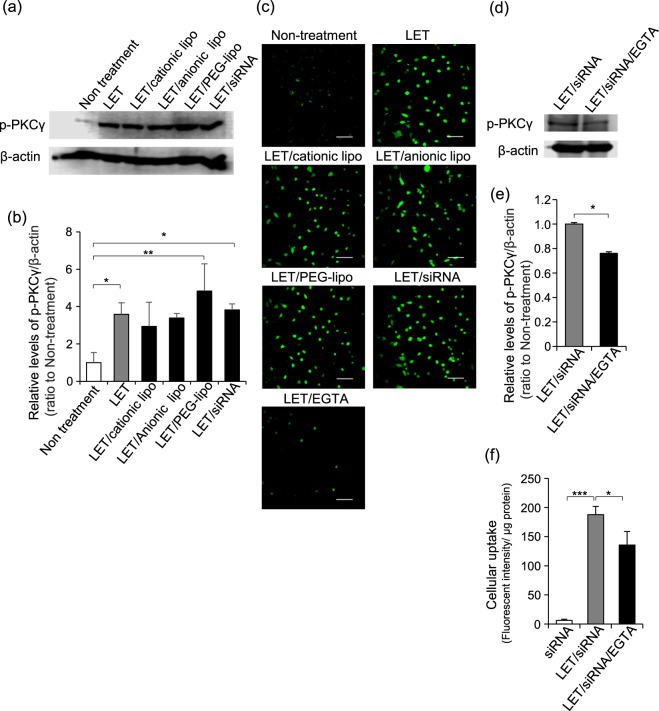
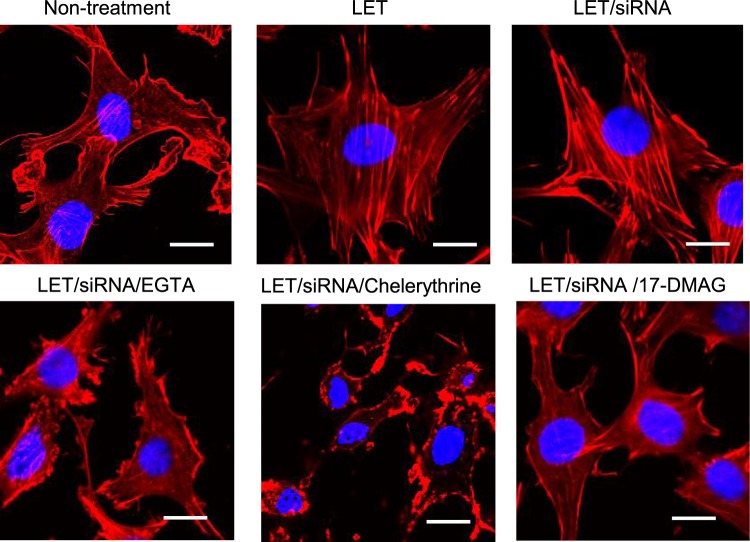
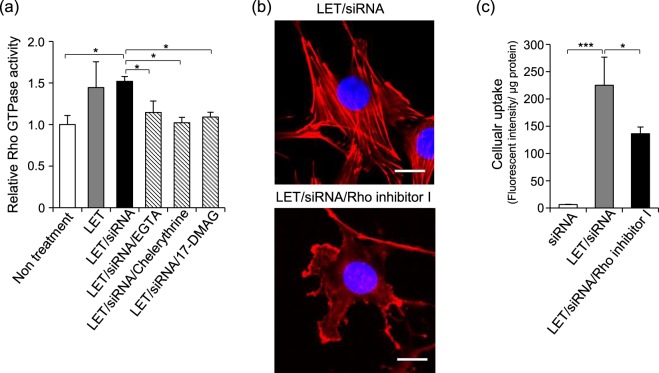
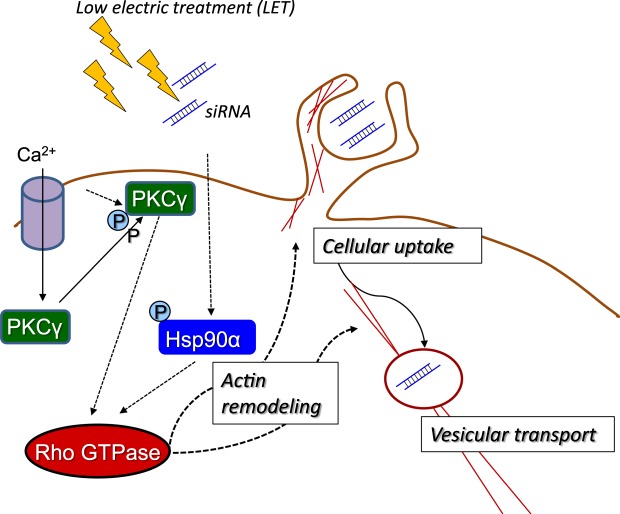
Low electric treatment (LET) promotes intracellular delivery of naked siRNA by altering cellular physiology. However, which signaling molecules and cellular events contribute to LET-mediated siRNA uptake are unclear. Here, we used isobaric tags in relative and absolute quantification (iTRAQ) proteomic analysis to identify changes in the levels of phosphorylated proteins that occur during cellular uptake of siRNA promoted by LET. iTRAQ analysis revealed that heat shock protein 90 (Hsp90)α and myristoylated alanine-rich C-kinase substrate (Marcks) were highly phosphorylated following LET of NIH 3T3 cells, but not untreated cells. Furthermore, the levels of phosphorylated Hsp90α and protein kinase C (PKC)γ were increased by LET both with siRNA and liposomes having various physicochemical properties used as model macromolecules, suggesting that PKCγ activated partly by Ca2+ influx as well as Hsp90 chaperone function were involved in LET-mediated cellular siRNA uptake. Furthermore, LET with siRNA induced activation of Rho GTPase via Hsp90 and PKC, which could contribute to cellular siRNA uptake accompanied by actin cytoskeleton remodeling. Collectively, our results suggested that LET-induced Rho GTPase activation via Hsp90 and PKC would participate in actin-dependent cellular uptake of siRNA.
Conflict of interest statement
The authors declare no competing interests.
Figures
Similar articles
-
Adducin is an in vivo substrate for protein kinase C: phosphorylation in the MARCKS-related domain inhibits activity in promoting spectrin-actin complexes and occurs in many cells, including dendritic spines of neurons.J Cell Biol. 1998 Jul 27;142(2):485-97. doi: 10.1083/jcb.142.2.485. J Cell Biol. 1998. PMID: 9679146 Free PMC article.
-
Calmodulin and protein kinase C cross-talk: the MARCKS protein is an actin filament and plasma membrane cross-linking protein regulated by protein kinase C phosphorylation and by calmodulin.Ciba Found Symp. 1992;164:145-54; discussion 154-61. doi: 10.1002/9780470514207.ch10. Ciba Found Symp. 1992. PMID: 1395931 Review.
-
PLCγ1-PKCγ signaling-mediated Hsp90α plasma membrane translocation facilitates tumor metastasis.Traffic. 2014 Aug;15(8):861-78. doi: 10.1111/tra.12179. Epub 2014 Jun 26. Traffic. 2014. PMID: 24899266
-
Inhibition of cell death by a novel 16.2 kD heat shock protein predominantly via Hsp90 mediated lipid rafts stabilization and Akt activation pathway.Apoptosis. 2007 Jan;12(1):97-112. doi: 10.1007/s10495-006-0486-x. Apoptosis. 2007. PMID: 17136496
-
New aspects of neurotransmitter release and exocytosis: Rho-kinase-dependent myristoylated alanine-rich C-kinase substrate phosphorylation and regulation of neurofilament structure in neuronal cells.J Pharmacol Sci. 2003 Sep;93(1):35-40. doi: 10.1254/jphs.93.35. J Pharmacol Sci. 2003. PMID: 14501149 Review.
Cited by
-
Extracellular vesicles from human adipose-derived stem cell spheroids: Characterization and therapeutic implications in diabetic wound healing.Mater Today Bio. 2024 Nov 8;29:101333. doi: 10.1016/j.mtbio.2024.101333. eCollection 2024 Dec. Mater Today Bio. 2024. PMID: 39619638 Free PMC article.
-
Emerging technologies towards extracellular vesicles large-scale production.Bioact Mater. 2025 Jun 13;52:338-365. doi: 10.1016/j.bioactmat.2025.06.005. eCollection 2025 Oct. Bioact Mater. 2025. PMID: 40585384 Free PMC article. Review.
-
Intradermal Delivery of Naked mRNA Vaccines via Iontophoresis.Pharmaceutics. 2023 Nov 26;15(12):2678. doi: 10.3390/pharmaceutics15122678. Pharmaceutics. 2023. PMID: 38140019 Free PMC article. Review.
-
Engineering Extracellular Vesicles as Delivery Systems in Therapeutic Applications.Adv Sci (Weinh). 2023 Jun;10(17):e2300552. doi: 10.1002/advs.202300552. Epub 2023 Apr 20. Adv Sci (Weinh). 2023. PMID: 37080941 Free PMC article. Review.
-
Extracellular vesicles: From large-scale production and engineering to clinical applications.J Tissue Eng. 2025 Apr 30;16:20417314251319474. doi: 10.1177/20417314251319474. eCollection 2025 Jan-Dec. J Tissue Eng. 2025. PMID: 40322740 Free PMC article. Review.
References
-
- Takahashi Y, Nishikawa M, Takakura Y. Nonviral vector-mediated RNA interference: its gene silencing characteristics and important factors to achieve RNAi-based gene therapy. Adv. Drug Deliv. Rev. 2009;61:760–766. - PubMed
-
- Nakamura Y, Kogure K, Futaki S, Harashima H. Octaarginine-modified multifunctional envelope-type nano device for siRNA. J. Control. Release. 2007;119:360–367. - PubMed
Publication types
MeSH terms
Substances
LinkOut - more resources
Full Text Sources
Research Materials
Miscellaneous
