. 2019 May;3(5):772-779.
doi: 10.1038/s41559-019-0838-x. Epub 2019 Mar 11.

Air temperature optima of vegetation productivity across global biomes

Affiliations

Air temperature optima of vegetation productivity across global biomes

Mengtian Huang et al. Nat Ecol Evol. 2019 May.

Abstract

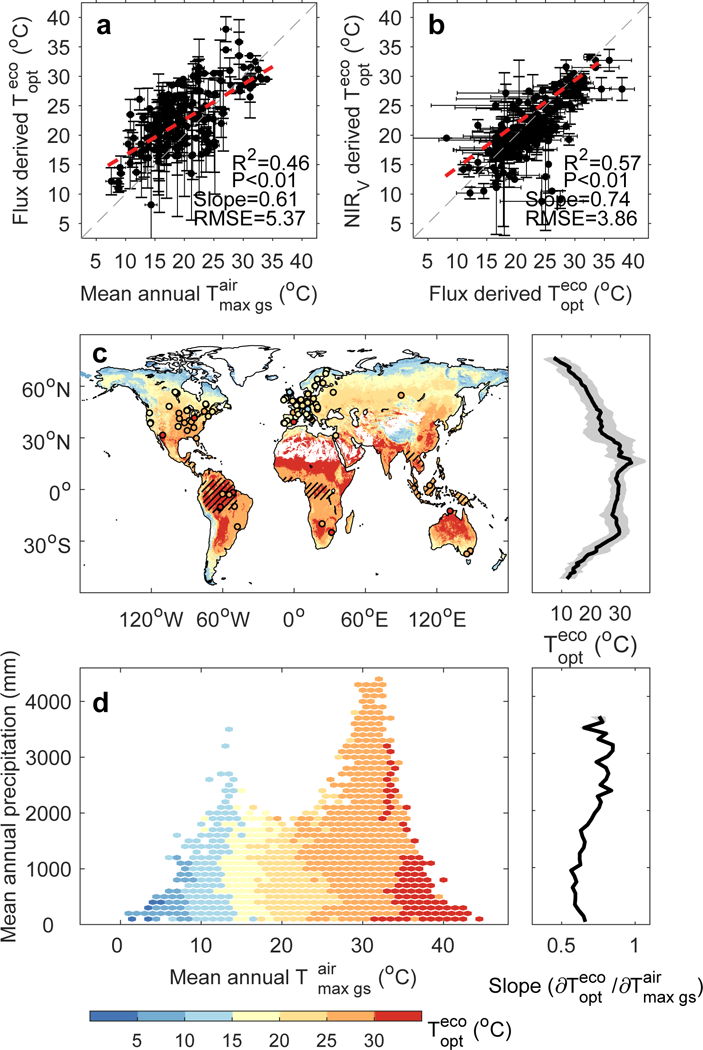
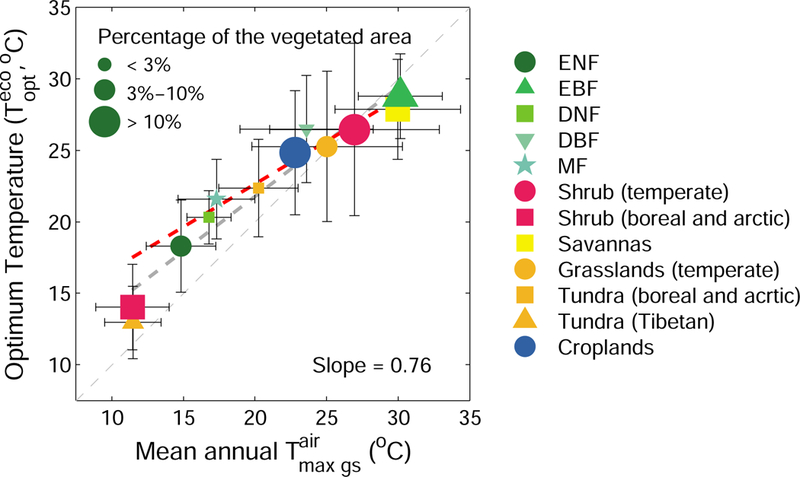
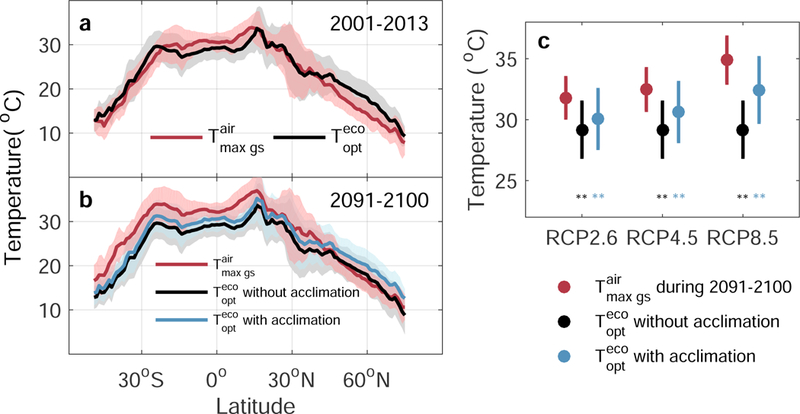
The global distribution of the optimum air temperature for ecosystem-level gross primary productivity ([Formula: see text]) is poorly understood, despite its importance for ecosystem carbon uptake under future warming. We provide empirical evidence for the existence of such an optimum, using measurements of in situ eddy covariance and satellite-derived proxies, and report its global distribution. [Formula: see text] is consistently lower than the physiological optimum temperature of leaf-level photosynthetic capacity, which typically exceeds 30 °C. The global average [Formula: see text] is estimated to be 23 ± 6 °C, with warmer regions having higher [Formula: see text] values than colder regions. In tropical forests in particular, [Formula: see text] is close to growing-season air temperature and is projected to fall below it under all scenarios of future climate, suggesting a limited safe operating space for these ecosystems under future warming.


Conflict of interest statement

Competing interests: Authors declare no competing interests.

Figures

Fig. 1 |
Fig. 1 |. Distribution of ecosystem-scale optimal temperature (Topteco) for vegetation productivity derived from flux tower sites and satellite-based data for near-infrared reflectance of vegetation (NIRV).
a, Relationship between mean annual daily maximum air temperature during the growing season (Tmax gsair) and Topteco derived from daily measurements of photosynthesis across eddy-covariance sites. Flux-derived Tmax gsair and Topteco were both obtained using observations from flux towers. Error bars indicate ±SD. The dotted gray line represents y=x and the dot line in red is y=0.61x+10.65, which is derived by linear regression with the statistical significance of the slope, or its p-value, given by Student’s t test. b, Relationship between Topteco derived from flux data and Topteco derived from NIRV data. For each site, we extracted and averaged Topteco values within a 3×3 pixel window around the site from NIRV-derived Topteco map, and calculated the SD of the nine Topteco values within the window. Error bars indicate ±SD. The dotted gray line represents y=x and the dot line in red is y=0.74x+7.10, which is derived by linear regression with the statistical significance of the slope, or its p-value, given by Student’s t test. c, Spatial distribution of Topteco for vegetation productivity (left panel), and Topteco averaged by latitude (right panel). Topteco is determined using NIRV data calculated based on satellite observations from Moderate Resolution Imaging Spectroradiometer (MODIS). Note that only gridded pixels with annual mean NDVI value larger than 0.1 and detectable Topteco are shown here. Areas of tropical forests based on current vegetation distribution are indicated by hatching. The circles on the map are colored according to the local value of Topteco retrieved from GPP at the location of each flux site. The solid line and shaded area in the right panel indicate the mean and SD, respectively, of Topteco summarized by latitude. d, Topteco in the climate space (left panel) and the temperature sensitivity of Topteco along the precipitation gradient (right panel). Each climate bin is defined by 1-°C intervals of Tmax gsair and 100-mm intervals of mean annual precipitation, based on current climate conditions averaged over 2001–2013. The solid line in the right panel represents the temperature sensitivity of Topteco along the precipitation gradient, calculated as the slope of the linear regression between Topteco and Tmax gsair for a given precipitation level. The shaded area indicates the SD of temperature sensitivity of Topteco estimated by bootstrapping.
Fig. 2 |
Fig. 2 |. Relationship between mean annual daily maximum air temperature during the growing season (Tmax gsair) and ecosystem-scale optimum temperature for vegetation productivity (Topteco) across vegetation types.
The error bars indicate the SDs of Topteco/Tmax gsair for each vegetation type: ENF, evergreen needle-leaved forest; EBF, evergreen broad-leaved forest; DNF, deciduous needle-leaved forest; DBF, deciduous broad-leaved forest; MF, mixed forest; Shrub, closed and open shrublands. The light-gray dotted line represents y=x. The dark-gray dotted line is y=0.76x+6.48 derived by linear regression with the slope value (estimated using Student’s t test) shown in the bottom right. The red dotted line is the flux tower derived slope (0.61) from Fig. 1a. The size of each symbol corresponds to the three categories (< 3%, 3%−10% and > 10%) of occupied vegetated area on land. Error bars indicate ±SD.
Fig. 3 |
Fig. 3 |. Change with latitude in ecosystem-scale optimal temperature for vegetation productivity (Topteco) and daily maximum air temperature averaged over the growing season (Tmax gsair).
a, Current Topteco versus current Tmax gsair; b, Future Topteco versus future Tmax gsair. Current Topteco and Tmax gsair are calculated using current temperature for 2001–2013, whereas acclimated Topteco and future Tmax gsair are first calculated pixel by pixel using temperature for 2091–2100 projected by General Circulation Models (GCMs) under the RCP4.5 scenario and then averaged by latitude. Acclimated Topteco is determined based on the projected temperature and temperature sensitivity of Topteco using the annual precipitation level predicted for 2091–2100. The solid line and shaded area in each panel indicate the mean and SD, respectively, of Topteco or Tmax gsair summarized by latitude. c, Future Topteco versus future Tmax gsair for tropical evergreen forests. ** indicates that Topteco is significantly lower than Tmax gsair at P<0.01 in a paired t-test. Error bars indicate ±SD.

Comment in

  • Just the right temperature.
    Way DA. Way DA. Nat Ecol Evol. 2019 May;3(5):718-719. doi: 10.1038/s41559-019-0877-3. Nat Ecol Evol. 2019. PMID: 30988494 No abstract available.

References

    1. Berry J & Bjorkman O Photosynthetic response and adaptation to temperature in higher plants. Annual Review of Plant Physiology 31, 491–543 (1980).
    1. Hughes L Biological consequences of global warming: is the signal already apparent? Trends in Ecology & Evolution 15, 56–61 (2000). - PubMed
    1. Niu S et al. Climatic warming changes plant photosynthesis and its temperature dependence in a temperate steppe of northern China. Environmental and Experimental Botany 63, 91–101 (2008).
    1. Way DA, Yamori W Thermal acclimation of photosynthesis: on the importance of adjusting our definitions and accounting for thermal acclimation of respiration. Photosynthesis research 119, 89–100 (2014). - PubMed
    1. Kattge J, Knorr W Temperature acclimation in a biochemical model of photosynthesis: a reanalysis of data from 36 species. Plant, cell & environment 30, 1176–1190 (2007). - PubMed

Publication types