. 2019 Sep;123(3):287-306.
doi: 10.1038/s41437-019-0205-3. Epub 2019 Mar 11.

Statistical power in genome-wide association studies and quantitative trait locus mapping

Affiliations

Statistical power in genome-wide association studies and quantitative trait locus mapping

Meiyue Wang et al. Heredity (Edinb). 2019 Sep.

Abstract

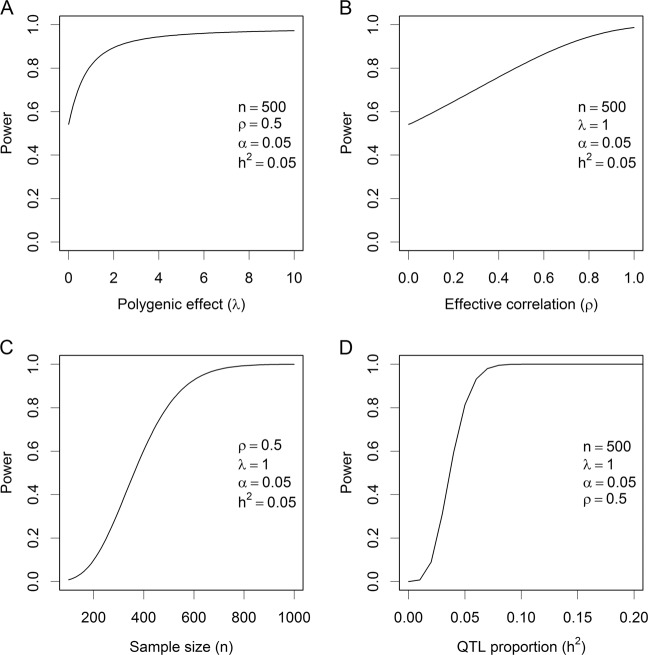
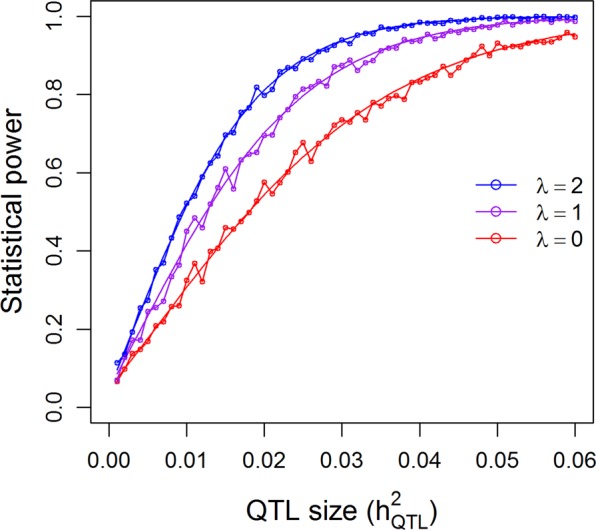
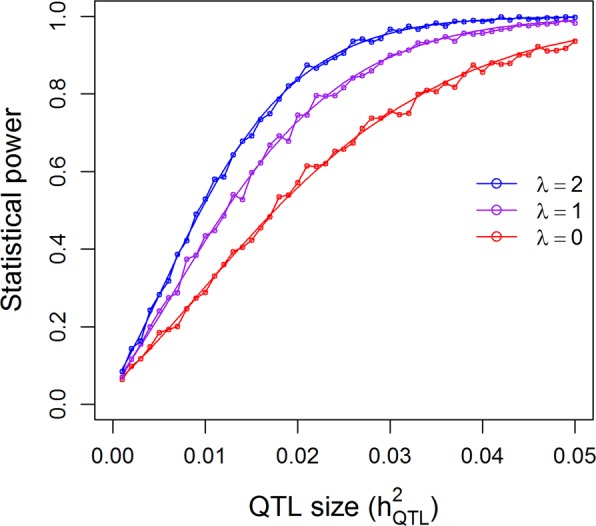
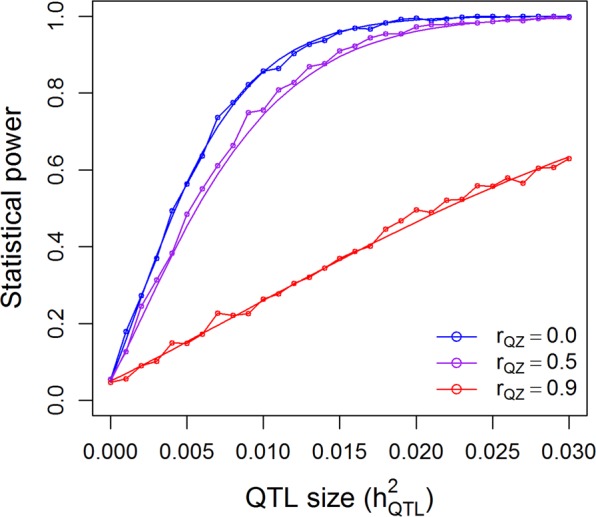
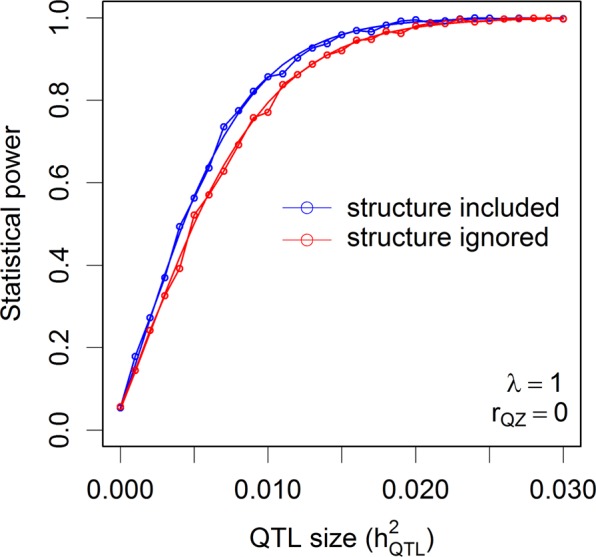
Power calculation prior to a genetic experiment can help investigators choose the optimal sample size to detect a quantitative trait locus (QTL). Without the guidance of power analysis, an experiment may be underpowered or overpowered. Either way will result in wasted resource. QTL mapping and genome-wide association studies (GWAS) are often conducted using a linear mixed model (LMM) with controls of population structure and polygenic background using markers of the whole genome. Power analysis for such a mixed model is often conducted via Monte Carlo simulations. In this study, we derived a non-centrality parameter for the Wald test statistic for association, which allows analytical power analysis. We show that large samples are not necessary to detect a biologically meaningful QTL, say explaining 5% of the phenotypic variance. Several R functions are provided so that users can perform power analysis to determine the minimum sample size required to detect a given QTL with a certain statistical power or calculate the statistical power with given sample size and known values of other population parameters.


Conflict of interest statement

The authors declare that they have no conflict of interest.

Figures

Fig. 1
Fig. 1
Relationship among the Type 1 and Type 2 errors, and the statistical power. a The null distribution (left) and the alternative distribution (right), where the upper tail of the null distribution highlighted in light gray represents the Type 1 error and the lower tail of the alternative distribution highlighted in dark gray represents the Type 2 error. b Changes of the Type 1 and Type 2 errors, and the statistical power as the critical value (the vertical line) changes
Fig. 2
Fig. 2
The receiver operating characteristic (ROC) curves of three methods (or different sample sizes). The curve in red deviating away the most from the diagonal line is the best method. The curve in blue is not as good as the red curve. The curve in purple closer to the diagonal line is the worst method among the three
Fig. 3
Fig. 3
Change of statistical power. a Power changes as the polygenic effect increases in the situation where the sample size is 500, the QTL size is 0.05, the linkage disequilibrium parameter is 0.5 and the nominal Type 1 error is 0.05 (corresponding to 0.05/100,000 after Bonferroni correction for 10k scanned markers). b Power changes as the effective correlation changes in the situation where the polygenic effect size is 1, the sample size is 500, the QTL size is 0.05, and the nominal Type 1 error is 0.05. c Power changes as the sample size increases in the situation where the polygenic effect is 1, the QTL size is 0.05, the linkage disequilibrium parameter is 0.5 and the nominal Type 1 error is 0.05. d Power changes as the QTL size increases in the situation where the polygenic effect is 1, the sample size is 500, the linkage disequilibrium parameter is 0.5 and the nominal Type 1 error is 0.05
Fig. 4
Fig. 4
Comparison of the theoretical powers to the empirical powers from simulation studies using the kinship matrix of 210 recombinant inbred lines (RIL) of rice under the additive model. Smooth curves are theoretical power functions and fluctuated curves tagged with open circles are empirical power functions obtained from simulations. The power functions are evaluated under three levels of polygenic contribution represented by the ratios of the polygenic variance to the residual variance (λ=σξ2σ2)
Fig. 5
Fig. 5
Comparison of the theoretical powers to the empirical powers from simulation studies using the kinship matrix of 278 hybrid rice under the additive plus dominance model. Smooth curves are theoretical power functions and fluctuated curves tagged with open circles are empirical power functions obtained from simulations. The power functions are evaluated under three levels of polygenic contribution represented by the ratios of the polygenic variance to the residual variance (λ=σξ2σ2)
Fig. 6
Fig. 6
Comparison of the theoretical powers to the empirical powers from simulation studies using the kinship matrix of 524 rice cultivars with correction for population structures (indica and japonica subspecies). Smooth curves are theoretical power functions and fluctuated curves tagged with open circles are empirical power functions obtained from simulations. The power functions are evaluated under λ=σξ2σ2=1 and three levels of correlation between population structure (Q) and the genotypic indicator variable (Z)
Fig. 7
Fig. 7
Comparison of the theoretical powers to the empirical powers from simulation studies using the kinship matrix of 524 rice cultivars with and without correction for population structures (indica and japonica subspecies). Smooth curves are theoretical power functions and fluctuated curves tagged with open circles are empirical power functions obtained from simulations. The power functions are evaluated under λ=σξ2σ2=1 and the correlation between population structure (Q) and the genotypic indicator variable (Z) is rQZ = 0

References

    1. Almasy L, Blangero J. Multipoint quantitative-trait linkage analysis in general pedigrees. Am J Human Genet. 1998;62:1198–1211. doi: 10.1086/301844. - DOI - PMC - PubMed
    1. Amos CI. Robust variance-components approach for assessing genetic linkage in pedigrees. Am J Human Genet. 1994;54:535–543. - PMC - PubMed
    1. Andersen EB. Asymptotic properties of conditional maximum likelihood estimators. J R Stat Soc B. 1970;32:283–301.
    1. Atwell S, Huang YS, Vilhjálmsson BJ, Willems G, Horton M, Li Y, Meng D, Platt A, Tarone AM, Hu TT, et al. Genome-wide association study of 107 phenotypes in Arabidopsis thaliana inbred lines. Nature. 2010;465:627. doi: 10.1038/nature08800. - DOI - PMC - PubMed
    1. Baldwin-Brown JG, Long AD, Thornton KR. The power to detect quantitative trait loci using resequenced, experimentally evolved populations of diploid, sexual organisms. Mol Biol Evol. 2014;31:1040–1055. doi: 10.1093/molbev/msu048. - DOI - PMC - PubMed

Publication types

Substances