. 2019 Nov;26(11):2464-2478.
doi: 10.1038/s41418-019-0313-x. Epub 2019 Mar 11.

TBC1D24 regulates axonal outgrowth and membrane trafficking at the growth cone in rodent and human neurons

Affiliations

TBC1D24 regulates axonal outgrowth and membrane trafficking at the growth cone in rodent and human neurons

Davide Aprile et al. Cell Death Differ. 2019 Nov.

Abstract

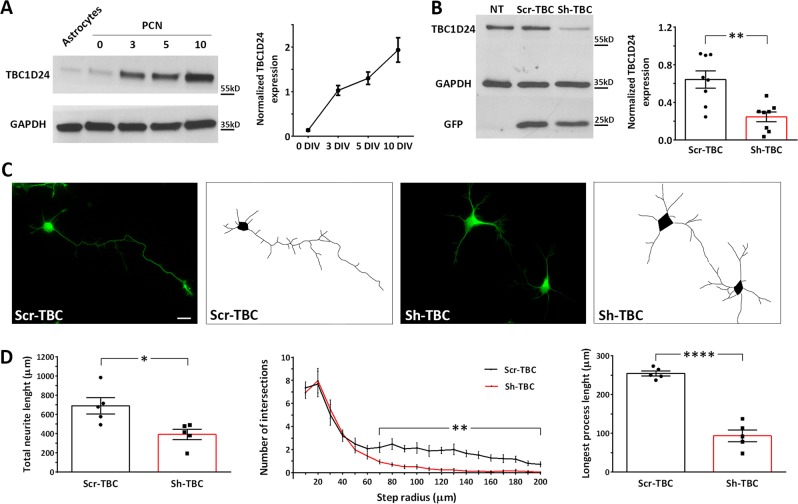
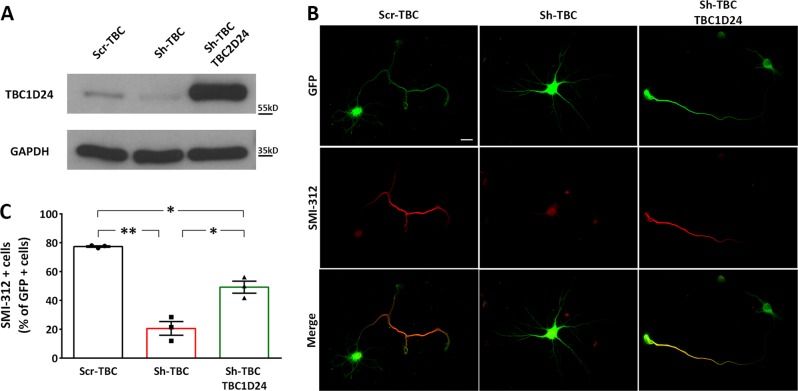
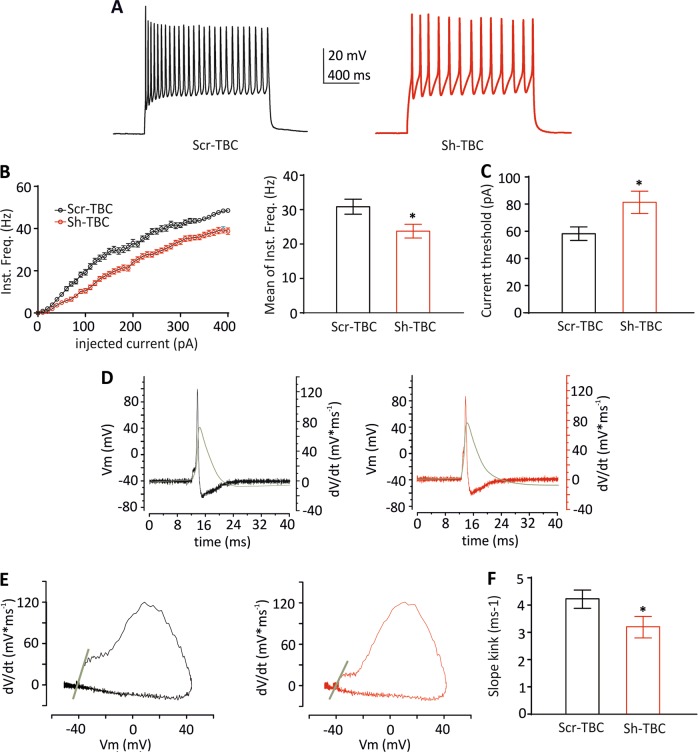
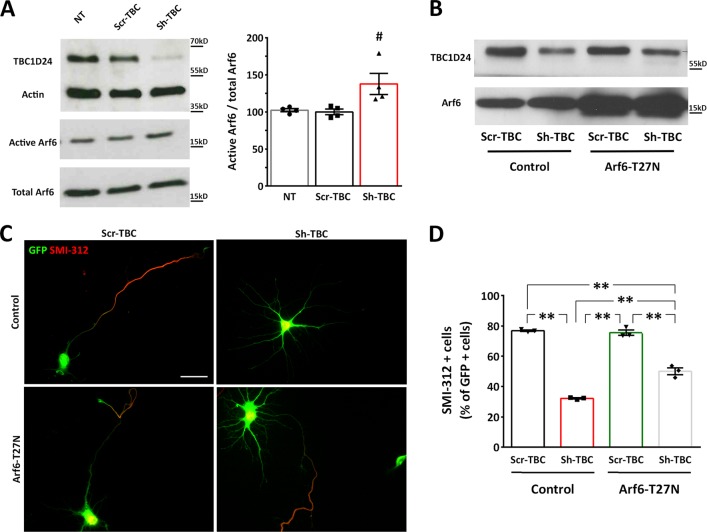
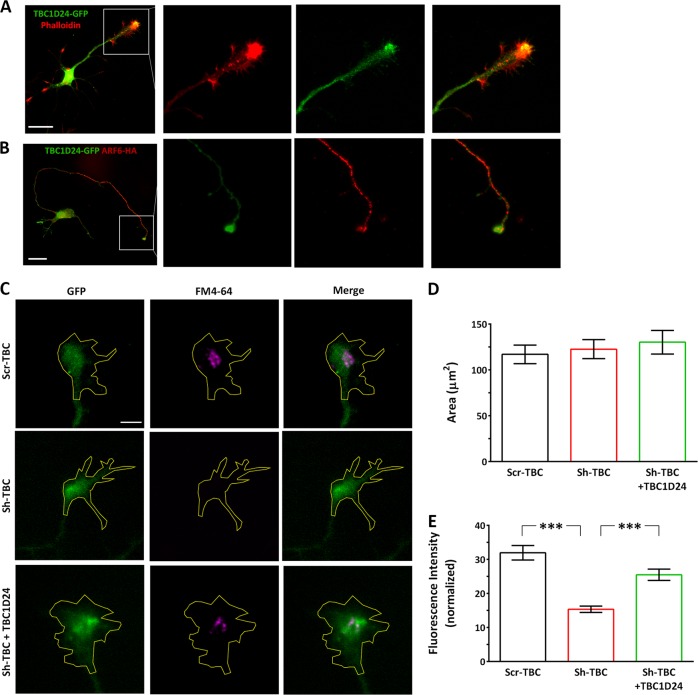
Mutations in TBC1D24 are described in patients with a spectrum of neurological diseases, including mild and severe epilepsies and complex syndromic phenotypes such as Deafness, Onycodystrophy, Osteodystrophy, Mental Retardation and Seizure (DOORS) syndrome. The product of TBC1D24 is a multifunctional protein involved in neuronal development, regulation of synaptic vesicle trafficking, and protection from oxidative stress. Although pathogenic mutations in TBC1D24 span the entire coding sequence, no clear genotype/phenotype correlations have emerged. However most patients bearing predicted loss of function mutations exhibit a severe neurodevelopmental disorder. Aim of the study is to investigate the impact of TBC1D24 knockdown during the first stages of neuronal differentiation when axonal specification and outgrowth take place. In rat cortical primary neurons silenced for TBC1D24, we found defects in axonal specification, the maturation of axonal initial segment and action potential firing. The axonal phenotype was accompanied by an impairment of endocytosis at the growth cone and an altered activation of the TBC1D24 molecular partner ADP ribosylation factor 6. Accordingly, acute knockdown of TBC1D24 in cerebrocortical neurons in vivo analogously impairs callosal projections. The axonal defect was also investigated in human induced pluripotent stem cell-derived neurons from patients carrying TBC1D24 mutations. Reprogrammed neurons from a patient with severe developmental encephalopathy show significant axon formation defect that were absent from reprogrammed neurons of a patient with mild early onset epilepsy. Our data reveal that alterations of membrane trafficking at the growth cone induced by TBC1D24 loss of function cause axonal and excitability defects. The axonal phenotype correlates with the disease severity and highlight an important role for TBC1D24 in connectivity during brain development.


Conflict of interest statement

The authors declare no conflict of interests.

Figures

Fig. 1
Fig. 1
TBC1D24 expression increases in PCN at early stages of development and its silencing leads to a reduced neurite arborisation. a Representative western blot analysis showing TBC1D24 expression in rat PCNs at various stages of differentiation and in twin astrocytic cultures. Densitometric quantification with respect to time 0 is shown in the line plot on the right. Data are means ± SEM of 5 experiments from 3 independent preparations. b Representative western blot analysis showing the effective TBC1D24 silencing in rat PCNs after 5 days of transfection. Densitometric quantification is shown on the right. GAPDH is shown for equal loading and used for normalization. GFP is shown as reporter of positive transfection. Data are means ± SEM from 8 independent preparations. c Representative images of control and TBC1D24-silenced GFP-positive PCNs transfected at 0 DIV and analyzed at 5 DIV. The respective manual tracings are shown on the right of each image. Scale bar, 20 μm. d Total neurite length (left), Sholl analysis (center) and measurement of the longest neurite (right) of control and TBC1D24-silenced neurons treated as in C. Data are means ± SEM from 5 independent preparations (88 and 93 neurons were analyzed for Scr-TBC and Sh-TBC respectively). Student’t test: *p < 0.05; **p < 0.005; ****p < 0.0001
Fig. 2
Fig. 2
Silencing of TBC1D24 impairs axon specification. a Representative western blot showing overexpression of TBC1D24 and its resistance to the Sh-TBC. GAPDH is shown for equal loading. b Representative images of transfected GFP-positive PCNs labelled for the axonal marker SMI-312 (red). Scale bar 20 μm). c The frequency SMI-312-positive neurons is expressed in percent of the total number of GFP-positive cells from 3 independent preparations (60 neurons were analyzed for each experimental group). One-way ANOVA/Bonferroni’s tests: *p < 0.05; **p < 0.001
Fig. 3
Fig. 3
Silencing of TBC1D24 impairs AIS formation. a Representative images of transfected GFP-positive PCNs labelled for the AIS markers Ankyrin G (grey) and pan NaV (red) at 10 DIV. White arrows indicate immuno-positive AIS tracts. Scale bar, 20 µm. b Quantification of the number of Ankyrin G and pan NaV-positive cells expressed in percent on the total number of GFP-positive cells. Data are means ± SEM from 46 and 54 fields for Scr-TBC and Sh-TBC respectively, from 3 independent preparations. c High magnification of cells treated as in A. Scale bar, 5 μm. d Quantification of the Ankyrin G and pan NaV fluorescence intensity in immuno-positive control and TBC1D24-silenced neurons. e Comparative measurements of the AIS start, maximum and end distances from the cell body performed for both Ankyrin G (left) and pan NaV (right) immunostainings in control and TBC1D24-silenced neurons. Data are expressed as means ± SEM from 92-61 Ankyrin G and 71-13 pan NaV for Scr-TBC and Sh-TBC, respectively, in 3 independent preparations. Among GFP-positive neurons, Student’s t test: *p < 0.05; **p < 0.005; ****p < 0.0001
Fig. 4
Fig. 4
Silencing of TBC1D24 alters neuronal excitability. a Representative current-clamp recordings of spike trains evoked by somatic current injection of + 180 pA for 1 sec in GFP-positive neurons transfected with a Scr-TBC (black) and Sh-TBC (red). b Graphs showing instantaneous firing frequency versus injected current (left) and their averaged values (right). c Graphs showing current threshold. Data are means ± SEM of 29-32 cells from 2 independent preparations. d Representative action potentials (black and red traces for control and TBC1D24-silenced neurons, respectively) superimposed to the time course of the first derivative of the membrane voltage (dV/dt, grey traces). e Representative phase-plane plots of the first derivative of the membrane voltage (dV/dt) versus membrane voltage (Vm). The gray line represents the linear regression of the first 10 data points of the rising phase with a Y-value > 5 mV/ms, used to calculate the slope of the kink at the action potential threshold. f Slope of the phase-plane kink at the action potential threshold. Student’s t test: *p < 0.05
Fig. 5
Fig. 5
Silencing of TBC1D24 leads to an axonal projection defect. a Representative coronal cortical section from P7 rat brain electroporated at E15 with GFP. Boxes show areas used to calculate fluorescence intensity of neurons in the somatosensory cortex (Cx) and their projections extending toward the corpus callosum (cc). Scale bar, 1 mm. b Representative P7 somatosensory cortical sections showing GFP-positive cells in brains electroporated at E15 with the indicated plasmids. Scale bar, 500 µm. c High magnification of cc bundle under the same experimental conditions as in B showing GFP signal, SMI-312 labellling and their merge. Scale bar, 100 µm. d Quantification of the cc axon bundle GFP fluorescence intensity normalized to the respective GFP intensity in the ipsilateral Cx. Data are means ± SEM from 6 (Scr-TBC), 5 (Sh-TBC) and 6 (Sh-TBC + TBC1D24) brains obtained from two independent electroporation. *p < 0.05, **p < 0.001; Kruskal–Wallis/Dunn’s tests
Fig. 6
Fig. 6
An increased Arf6 activation is responsible for the defective axonal specification in TBC1D24-silenced neurons. a Representative western blot of active Arf6 immunoprecipitation from 5 DIV rat PCNs that were either untreated (NT) or transfected with Scr-TBC/Sh-TBC. Quantification of the Arf6-GTP normalized to total Arf6 is shown on the right. Data are means ± SEM from 4 independent experiments. # p < 0.05 with One-way ANOVA/Kruskal–Wallis’ test b Representative immunoblot TBC1D24 and Arf6 expression in Scr-TBC or Sh-TBC transfected neurons (5DIV) with or without concomitant Arf6T27N overexpression. c Representative images of GFP-positive neurons transfected as above and labelled for SMI-312 at 5 DIV. Scale bar, 20 μm. d Quantification of SMI-312-positive cells with respect to the total number of GFP-positive cells from 3 independent preparations (90, 222, 202 and 224 neurons were analyzed for Scr-TBC, Sh-TBC, Scr-TBC + Arf6-T27N and Sh-TBC + Arf6-T27N, respectively). One-way ANOVA/Bonferroni’s tests: ** p < 0.001
Fig. 7
Fig. 7
Silencing of TBC1D24 results in membrane trafficking defect at the growth cone. a Representative images of 3 DIV rat PCNs transfected with TBC1D24-GFP (green) and labelled with Alexa Fluor 546 phalloidin (red) to visualize GCs. Scale bar, 20 μm. White square indicates the magnified images on the right show the enrichment of TBC1D24 at the GC central domain. b Representative images of 3 DIV rat PCNs co-transfected with Arf6-HA (red) and TBC1D24-GFP (green). Scale bar, 20 μm. White square indicates the magnified images on the right showing colocalization of Arf6 and TBC1D24 at the GC. c Representative images of GFP-positive GCs from Scr-TBC, Sh-TBC and Sh-TBC/TBC1D24 transfected neurons after FM4-64 loading. Manual tracing of the GC area is shown. Scale bar, 5 μm. d Quantification of the GC area. e Quantification of FM4-64 fluorescence intensity normalized to the area analyzed. Data are means ± SEM of 63-128 PCNs from 3 independent preparations. Kruskal–Wallis/Dunn’s tests: ***p < 0.0001
Fig. 8
Fig. 8
hiPSC-derived neurons obtained from FIME and EOEE TBC1D24 patients show different axonal phenotypes. a Representative images of hiPSC-derived neurons at 10 days of differentiation from TBC1D24 patients (FIME, PAT 1 and EOEE, PAT 2) and controls (C1 and C2) were immunolabeled for SMI-312 and MAP2. Arrows indicate MAP2/SMI-312 double-positive neurons, while arrowheads indicate MAP2-positive/SMI312-negative neurons. Scale bar, 20 μm. b Representative experiments showing the developmental profile with percentages of SMI-312-positive cells in respect to the total MAP2-positive cells for hiPSC-derived neurons from TBC1D24 patients and relative controls. c Histograms showing the ratio of SMI-312 on MAP2-positive hiPSCs-derived neurons with respect to respective control hiPSCs-derived neurons (dotted line) at various times of differentiation. Data are means ± SEM of 4 experiments (two distinct clones from each experimental group). Fields analyzed for CTR 1, PAT 1, CTR 2, PAT 2, were respectively: 153, 211, 136, 212 (5 days of differentiation); 146, 209, 229, 199 (10 days of differentiation); 174, 92, 121, 120 (15 days of differentiation). Kruskal–Wallis/Dunn’s tests versus respective controls: **p < 0.01; ****p < 0.0001

References

    1. Balestrini S, Milh M, Castiglioni C, Lüthy K, Finelli M, Taylor JC. TBC1D24 genotype – phenotype correlation Epilepsies and other neurologic features. Neurology. 2016;87:77–85. doi: 10.1212/WNL.0000000000002807. - DOI - PMC - PubMed
    1. Azaiez H, Booth KT, Bu F, Huygen P, Shibata SB, Shearer AE, et al. TBC1D24 mutation causes autosomal-dominant nonsyndromic hearing Loss. Hum Mutat. 2014;35:819–23. doi: 10.1002/humu.22557. - DOI - PMC - PubMed
    1. Rehman AU, Santos-Cortez RLP, Morell RJ, Drummond MC, Ito T, Lee K, et al. Mutations in TBC1D24, a gene associated with epilepsy, also cause nonsyndromic deafness DFNB86. Am J Human Genet. 2014;94:144–52. doi: 10.1016/j.ajhg.2013.12.004. - DOI - PMC - PubMed
    1. Zhang L, Hu L, Chai Y, Pang X, Yang T, Wu H. A Dominant mutation in the stereocilia-expressing gene TBC1D24 is a probable cause for nonsyndromic hearing impairment. Hum Mutat. 2014;35:814–8. doi: 10.1002/humu.22558. - DOI - PubMed
    1. Finelli MJ, Oliver PL. TLDc proteins: new players in the oxidative stress response and neurological disease. Mamm Genome. 2017;28:395–406. doi: 10.1007/s00335-017-9706-7. - DOI - PMC - PubMed