

Review
doi: 10.1016/j.ogla.2018.06.002.
Epub 2018 Jul 7.
Glaucoma Diagnosis: from the Artisanal to the Defined
Affiliations
- PMID: 30859172
- PMCID: PMC6407894
- DOI: 10.1016/j.ogla.2018.06.002
Item in Clipboard
Review
Glaucoma Diagnosis: from the Artisanal to the Defined
Ophthalmol Glaucoma.
2018 Jul-Aug.
Abstract
In 400BC, Hippocrates wrote the first record of glaucoma. Since then, increasingly objective diagnostic techniques have enabled earlier detection of glaucoma and its progression, providing greater certainty in decision-making and early medical and surgical intervention.
Conflict of interest statement
Conflict of Interest: Dr. Schuman receives royalties for intellectual property licensed by Massachusetts Eye and Ear and Massachusetts Institute of Technology to Zeiss.
Figures
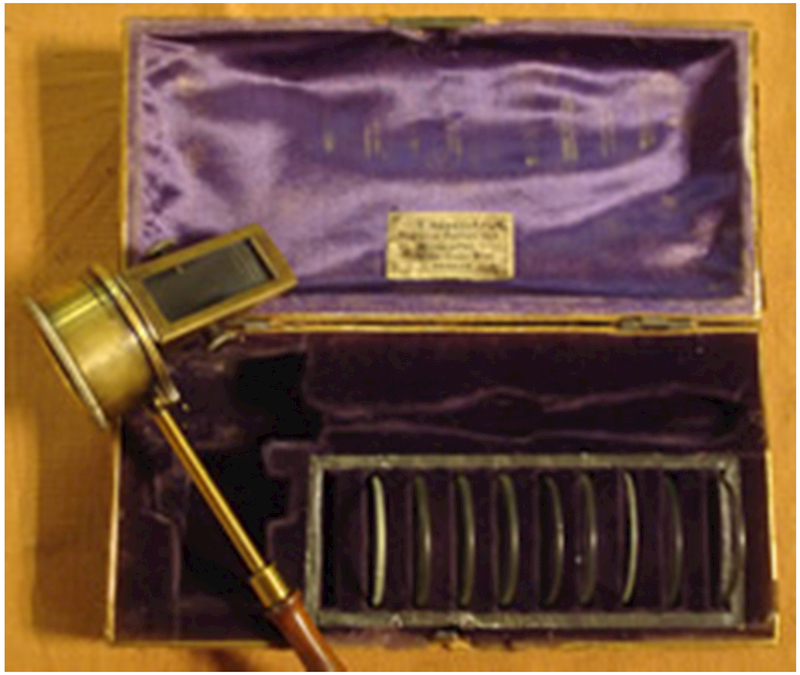
An early iteration of the Helmholtz ophthalmoscope, 1852. Courtesy of the “Joint Library of Ophthalmology Moorfields Eye Hospital & UCL Institute of Ophthalmology”. (Used with permission.)
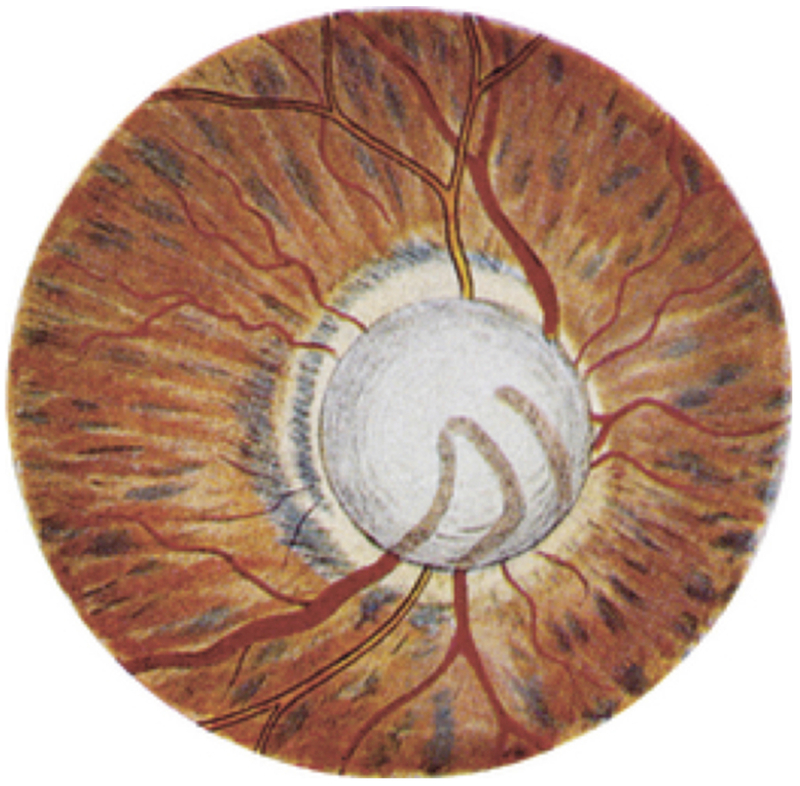
An 1854 illustration of a glaucomatous optic disc by Eduard Jaeger, drawn to depict protrusion and swelling, Jaeger’s interpretation of glaucomatous disc change. The image was originally published in his text, Ueber Staar und Staaroperationen (Wien) (Used with permission.)
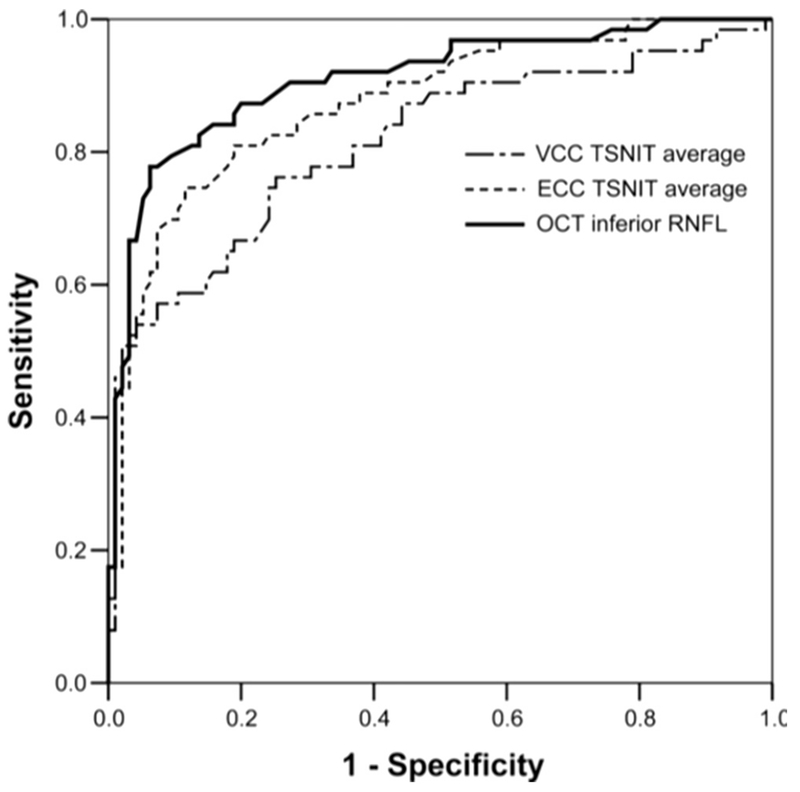
AUROCs for the best parameters obtained using three objective, quantitative methods of structural assessment demonstrate the superiority of OCT (inferior average thickness, AUROC = 0.91) over scanning laser polarimetry with enhanced (TSNIT, AUROC = 0.87) or variable (TSNIT, AUROC = 0.81) corneal compensation. Originally published in Sehi M, Ume S, Greenfield DS. Scanning laser polarimetry with enhanced corneal compensation and optical coherence tomography in normal and glaucomatous eyes. Invest Ophthalmol Vis Sci. 2007;48:2099-2014. (Used with permission.)
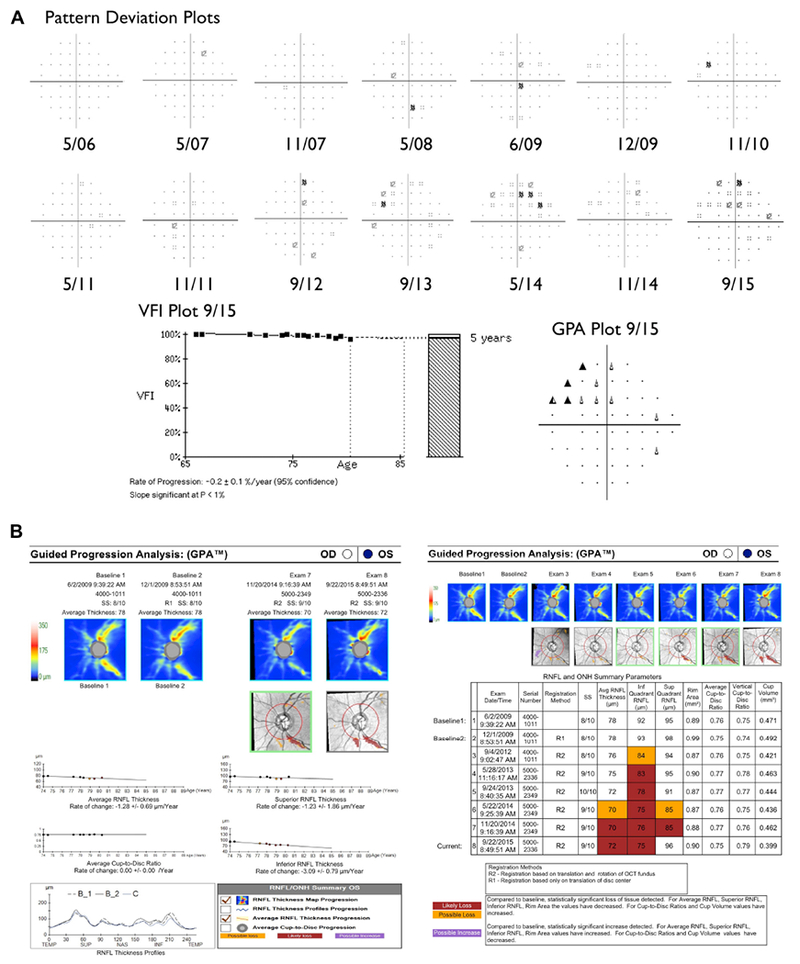
Visual field results (a) and OCT RNFL GPA reports (b) for a representative patient. These studies illustrate that, even when early abnormalities on VF or OCT are not statistically significant, one can be reasonably certain that real progression is occurring when changes are occurring in corresponding areas for both tests.
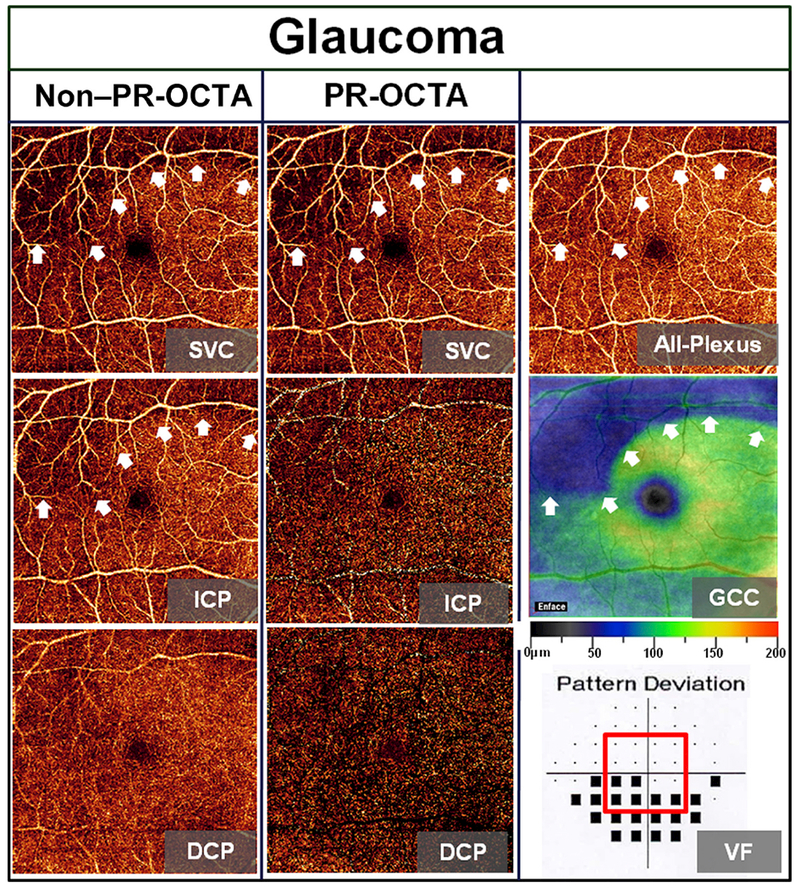
Data from a representative eye with glaucoma detectable on perimetric testing. The first and second columns display 6×6 mm en face angiograms from nonprojection-resolved OCTA and projection-resolved OCTA, respectively. The white arrows highlight the focal decrease in vessel density in a superior arcuate pattern in the superficial vascular complex (SVC) and all-plexus PR-OCTA images. The ganglion cell complex map (second image in third column) and visual field pattern deviation (third image in third column) demonstrate defects in corresponding locations. Of note, as might be expected, a corresponding decrease in vessel density was not found in the PR-OCTA for the intermediate capillary plexus (ICP) or deep capillary plexus (DCP). Originally published in Takusagawa HL, Liu L, Ma KN, et al. Projection-resolved optical coherence tomography angiography of macular retinal circulation in glaucoma. Ophthalmology. 2017;124:1589–1599. (Used with permission.)
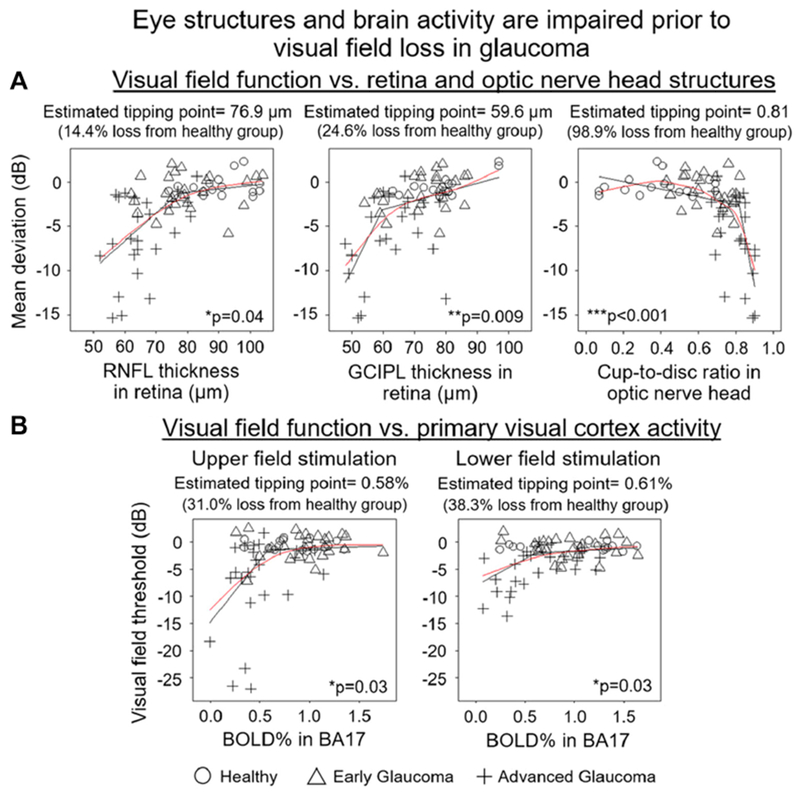
Assessment of the relationships between perimetric visual function and (a) structural measures of the of retina and ONH (b) visual cortex activity as measured by MRI blood-oxygenation-level-dependent (BOLD) signal revealed that each of these relationships can be described by broken-stick (segmented) models. That is, this study demonstrated that functional impairment in terms of visual field progression occurs only after a “tipping point” in term of other measurements of glaucoma damage, and this finding holds true not only for measures of ocular structure (tipping points were 76.9 μm for RNFL [95% confidence interval (C.I.) = 67.9 to 86.0 μm], 59.6 μm for GCIPL (95% C.I. = 54.5 to 64.7 μm) and 0.81 for cup-to-disc ratio (95% C.I. = 0.79 to 0.83)), but also for measures of brain function (topping point was BOLD = 0.58% for upper visual field stimulation (95% C.I. = 0.34 to 0.82%) and BOLD = 0.61% for lower visual field stimulation (95% C.I. = 0.30 to 0.92%)). Red line represents the spline fit, and the black line represents the broken stick fit model. (*p < 0.05, **p < 0.01, ***p < 0.001: Davies’ test for statistically significant difference in slope between segments). Originally published in Murphy MC, Conner IP, Teng CY et al. Retinal Structures and Visual Cortex Activity are Impaired Prior to Clinical Vision Loss in Glaucoma. Sci Rep. 2016;6:31464. (Used with permission.)
Similar articles
-
Structural glaucomatous damage vs. visual field defects: longitudinal study in patients with ocular hypertension or early primary open-angle glaucoma.Acta Ophthalmol Scand Suppl. 2002;236:45-6. doi: 10.1034/j.1600-0420.80.s236.26.x. Acta Ophthalmol Scand Suppl. 2002. PMID: 12390135 No abstract available.
-
Assessment of glaucoma imaging technology.Ophthalmology. 2008 Jul;115(7):1266-7; author reply 1267-8. doi: 10.1016/j.ophtha.2008.02.003. Ophthalmology. 2008. PMID: 18598824 No abstract available.
-
Mapping the visual field.Ophthalmology. 2001 Oct;108(10):1714. doi: 10.1016/s0161-6420(01)00733-3. Ophthalmology. 2001. PMID: 11581028 No abstract available.
-
Correlating Structural and Functional Damage in Glaucoma.J Glaucoma. 2019 Dec;28(12):1079-1085. doi: 10.1097/IJG.0000000000001346. J Glaucoma. 2019. PMID: 31478953 Review.
-
[The ophthalmoscopic characteristics of the optic disk and the retinal layer of nerve fibers of the retina in glaucoma].Vestn Oftalmol. 2005 Jul-Aug;121(4):46-9. Vestn Oftalmol. 2005. PMID: 16223048 Review. Russian. No abstract available.
Cited by
-
Literature Review on Artificial Intelligence Methods for Glaucoma Screening, Segmentation, and Classification.J Imaging. 2022 Jan 20;8(2):19. doi: 10.3390/jimaging8020019. J Imaging. 2022. PMID: 35200722 Free PMC article. Review.
-
Artificial Intelligence in Glaucoma: Advances in Diagnosis, Progression Forecasting, and Surgical Outcome Prediction.Int J Mol Sci. 2025 May 8;26(10):4473. doi: 10.3390/ijms26104473. Int J Mol Sci. 2025. PMID: 40429619 Free PMC article. Review.
References
-
- Hippocrates. Aphorisms. III. 31.6: The Internet Classic Archives; Translated by Adams Francis. classics.mit.edu/Hippocrates/aphorisms.html
-
- Aristotle. De Generatuibe Animalium. Translated by Peck AL 1970 Internet Archive Cambridge Harvard University Press; archive.org/details/generationofanim00arisuoft
-
- Galen. Ars Medica. Edited and translated by Ian Johnston. Loeb Classical Library; www.loebclassics.com/view/galen-art_medicine/2016/pb_LCL523.139.xml.
-
- Marjanovic I. The History of Detecting Glaucomatous Changes in the Optic Disc Glaucoma- Basic and Clinical Aspects. Belgrade, Serbia: a: Intech; p. chapter 13 (289).
-
- Mackenzie W Practical treatise on the Diseases of the Eye. London: Longman, Orme, Brown, Green and Longmans; 1830.
Publication types
MeSH terms
Grants and funding
LinkOut - more resources
Full Text Sources