. 2019 May;100(5):1266-1274.
doi: 10.4269/ajtmh.18-0783.

Complex Epidemiological Dynamics of Eastern Equine Encephalitis Virus in Florida

Affiliations

Complex Epidemiological Dynamics of Eastern Equine Encephalitis Virus in Florida

Lea A Heberlein-Larson et al. Am J Trop Med Hyg. 2019 May.

Abstract

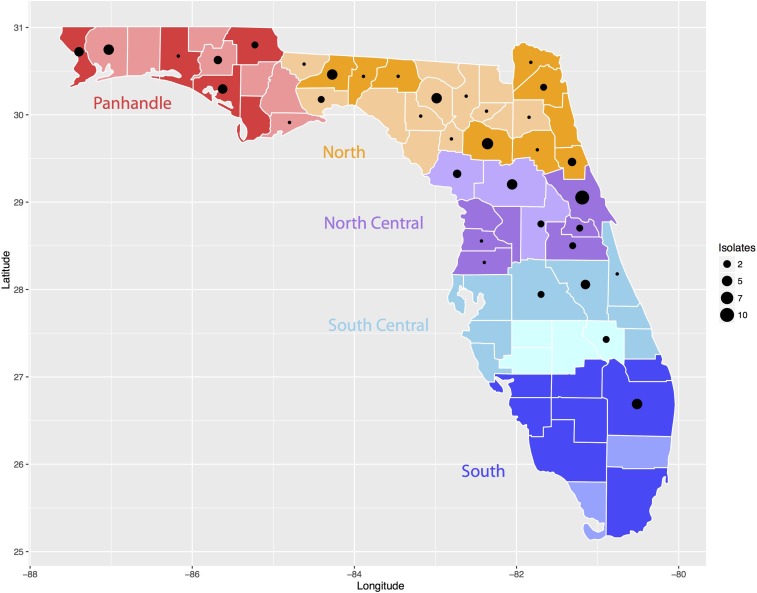
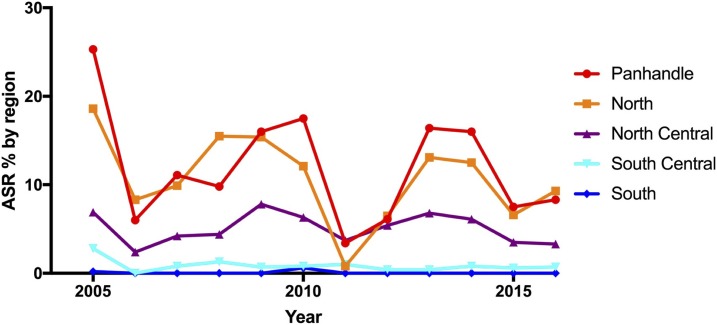
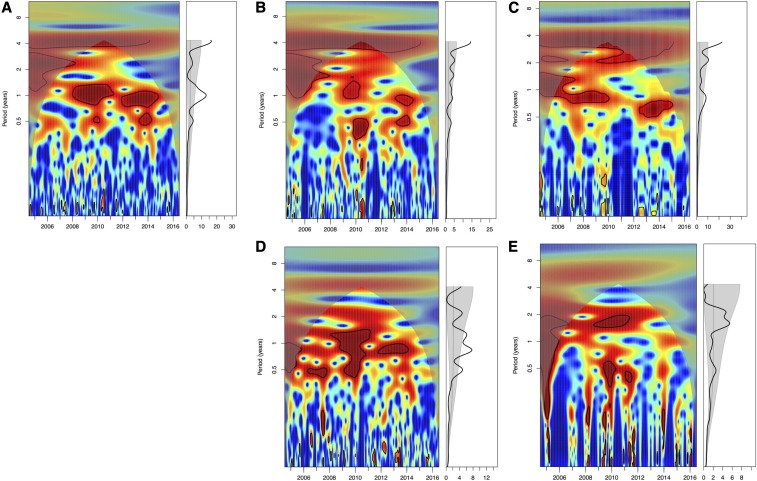
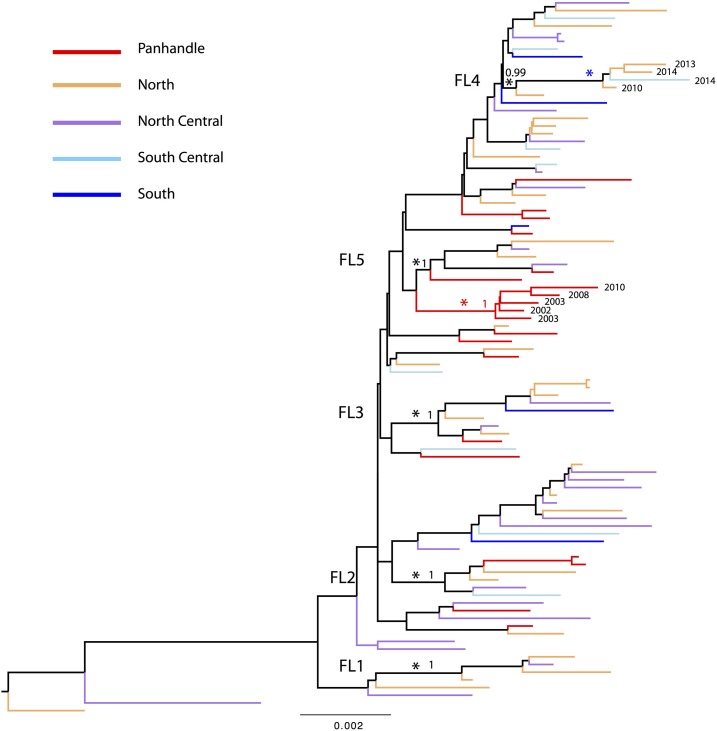
Eastern equine encephalitis virus (EEEV) infection results in high mortality in infected horses and humans. Florida has been identified as an important source of EEEV epidemics to other states in the United States. In this study, we further characterized the epidemiological and evolutionary dynamics of EEEV in Florida. Epidemiological analysis of sentinel chicken seroconversion rates to EEEV infections during 2005-2016 suggested significant seasonality of EEEV activity in Florida. We observed significant annual activity of EEEV in the North and North Central regions, with little significant seasonality in the Panhandle region. Phylogenetic analysis of complete EEEV genome sequences from different host sources and regions in Florida during 1986-2014 revealed extensive genetic diversity and spatial dispersal of the virus within Florida and relatively more clustering of the viruses in the Panhandle region. We found no significant association between EEEV genetic variation and host source. Overall, our study revealed a complex epidemiological dynamic of EEEV within Florida, implicating the Panhandle region as a possible source of the virus with sustained year-round transmission. These findings will help in implementing targeted control measures that can have the most impact in reducing or eliminating EEEV and other mosquito-borne viral infections within Florida and in the rest of the United States.


Figures

Figure 1.
Figure 1.
Map of Florida with five regions from which the eastern equine encephalitis virus (EEEV) isolates and sentinel chickens were sampled. The x axis represents longitude and y axis represents latitude. The five regions in Florida are colored and marked in the figure. The darker shading in each region indicates counties in the region participating in the sentinel chicken surveillance program during the study period, 2005 to 2016, whereas the lighter shade indicates no chicken surveillance data were available from those counties. Black dots in each county represent EEEV isolates and size of the dot represents the total number of isolates. This figure appears in color at www.ajtmh.org.
Figure 2.
Figure 2.
Annual seroconversion rate in percent of sentinel chickens seroconverting to eastern equine encephalitis virus in Florida by region, 2005 to 2016. Annual seroconversion rate in percent (the number of confirmed chickens divided by the number of susceptible chickens bled in each year and represented as percent) for the Panhandle region in red, North region in orange, North Central region in purple, South Central region in light blue, and the South region in dark blue. This figure appears in color at www.ajtmh.org.
Figure 3.
Figure 3.
Seasonality of eastern equine encephalitis virus activities in Florida, 2005–2016. Wavelet power spectrum of weekly confirmed seroconversion rates for (A) entire Florida, (B) Panhandle region, (C) North region, (D) North Central region, (E) South and South Central regions. Wavelet power spectrums identify changes in periodicities over time (left) and average periodicity (right). Power increases from blue to red, and red indicates stronger periodicities. Black lines highlight statistically significant periodicities, the annual/1-year periodicities in this study. This figure appears in color at www.ajtmh.org.
Figure 4.
Figure 4.
Phase analysis of sentinel chicken seroconversion rates in North and North Central regions in Florida. The blue and red lines represent the phase of time series of eastern equine encephalitis virus weekly seroconversion rates in the North region and North Central region at a periodicity of 0.8–1.2 years separately. Green line represents phase differences between the North and North Central regions. This figure appears in color at www.ajtmh.org.
Figure 5.
Figure 5.
Bayesian Markov chain Monte Carlo phylogenetic tree of eastern equine encephalitis virus (EEEV) sequences sampled from Florida. Sequences sampled from different regions in Florida are colored and described in the key. Five previously defined small monophyletic groups of Florida sequences are marked by black asterisk and indicated in the tree. Panhandle-only group is marked by red asterisk in the tree. The phylogenetic tree was rooted using the oldest EEEV sequence sampled from Florida in 1986, and scale bars represent the number of nucleotide substitutions per site. This figure appears in color at www.ajtmh.org.

References

    1. Centers for Disease Control and Prevention , 2017. Eastern Equine Encephalitis Epidemiology and Geographic Distribution. Available at: https://www.cdc.gov/easternequineencephalitis/tech/epi.html. Accessed November 12, 2018.
    1. Calisher CH, 1994. Medically important arboviruses of the United States and Canada. Clin Microbiol Rev 7: 89–116. - PMC - PubMed
    1. Morris CD, 1988. Eastern equine encephalomyelitis. Monath TP, ed. The Arboviruses: Epidemiology and Ecology. Boca Raton, FL: CRC Press, 1–20.
    1. Scott TW, Weaver SC, 1989. Eastern equine encephalomyelitis virus: epidemiology and evolution of mosquito transmission. Adv Virus Res 37: 277–328. - PubMed
    1. Centers for Disease Control and Prevention (CDC) , 2006. Eastern equine encephalitis—New Hampshire and Massachusetts, August–September 2005. Morb Mortal Wkly Rep 55: 697–700. - PubMed

Publication types

Substances

LinkOut - more resources