. 2019 Jun;33(6):7315-7330.
doi: 10.1096/fj.201802454RR. Epub 2019 Mar 12.

Magi-1 scaffolds NaV1.8 and Slack KNa channels in dorsal root ganglion neurons regulating excitability and pain

Affiliations

Magi-1 scaffolds NaV1.8 and Slack KNa channels in dorsal root ganglion neurons regulating excitability and pain

Kerri D Pryce et al. FASEB J. 2019 Jun.

Abstract

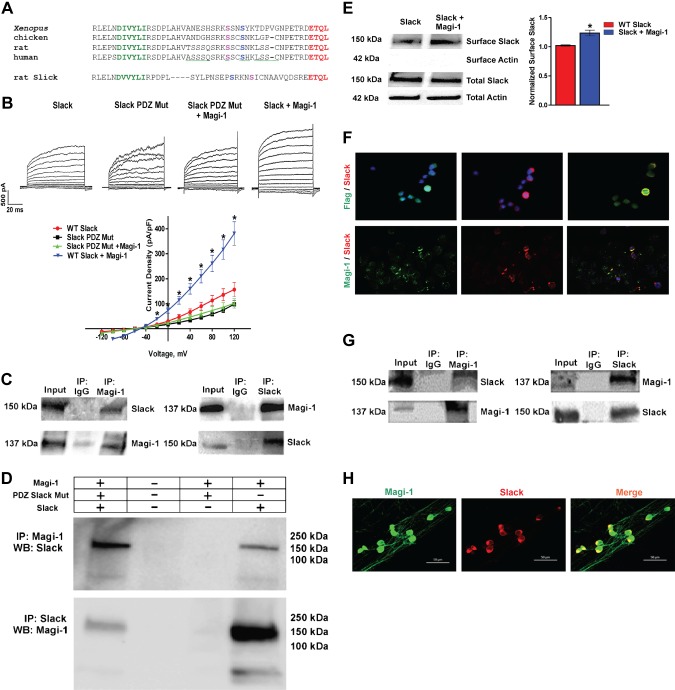
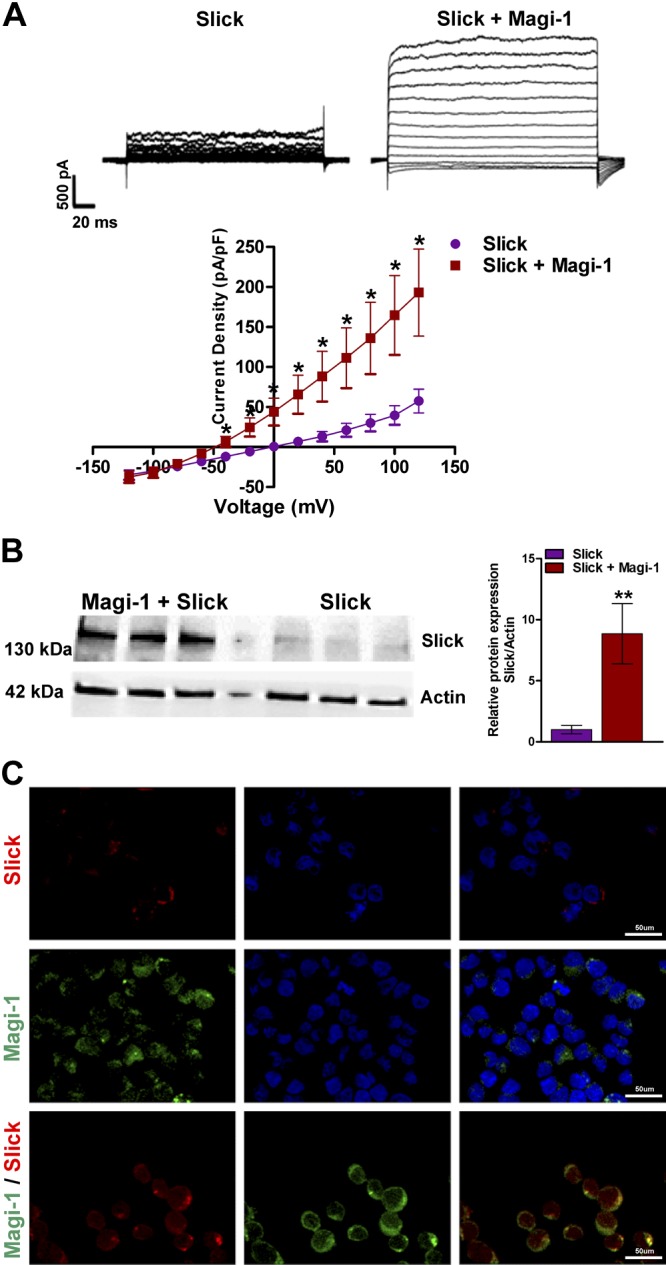
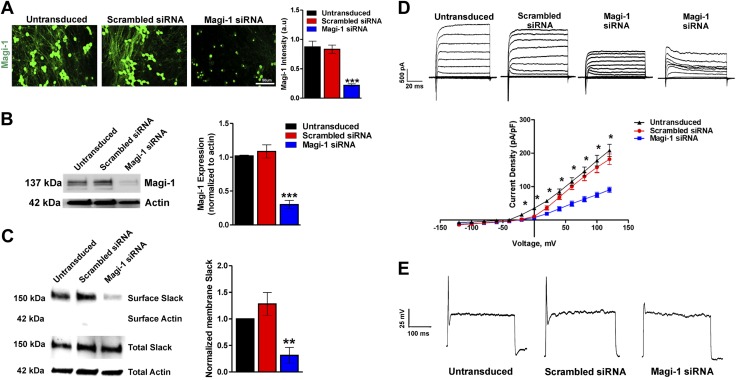
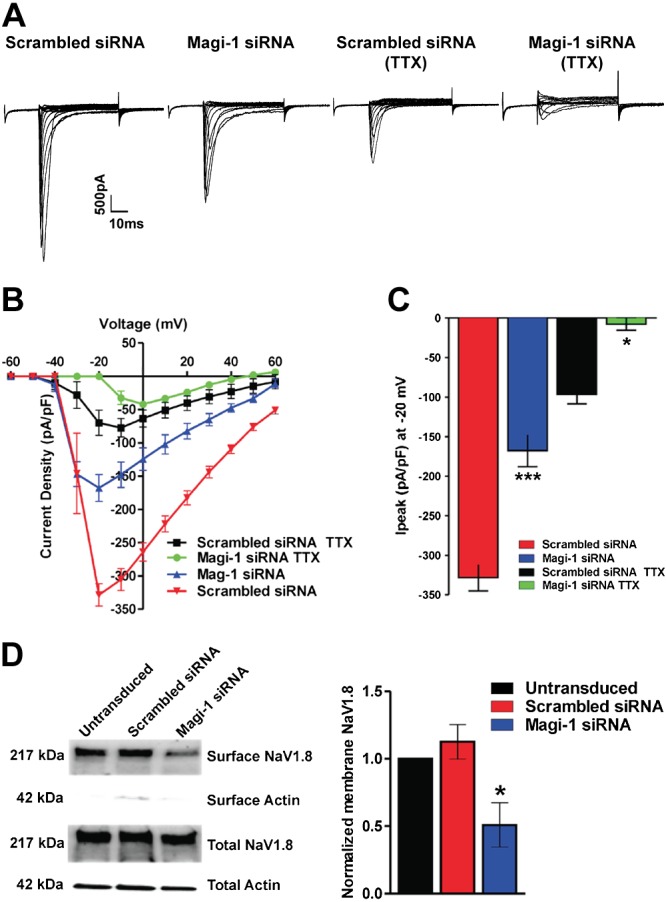
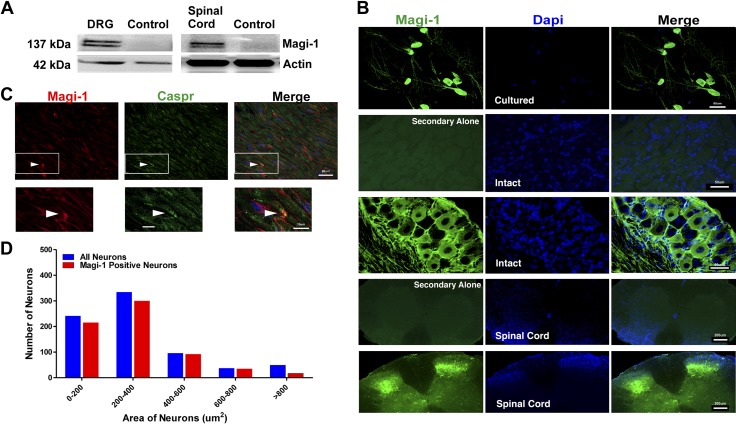
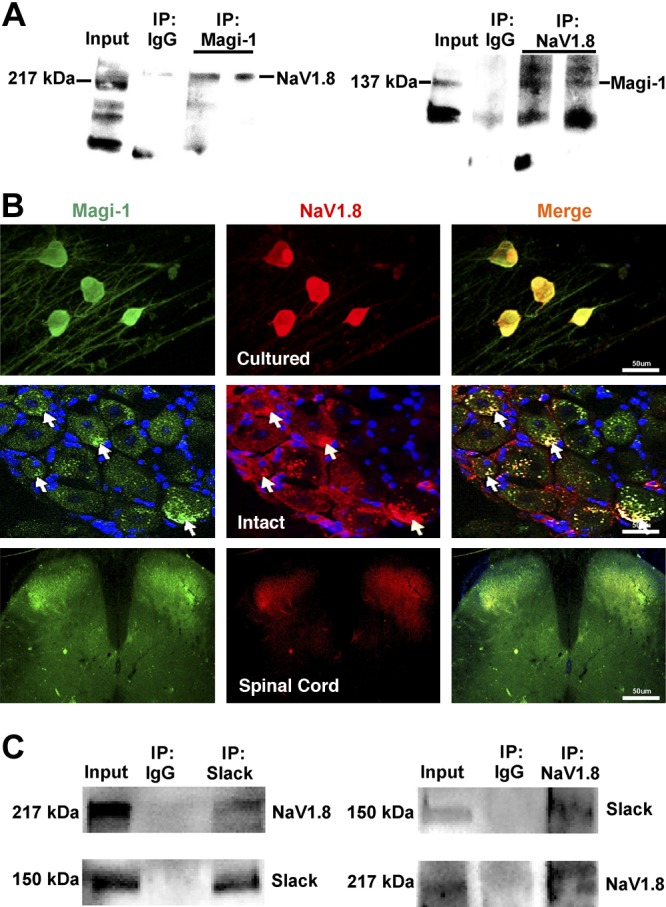
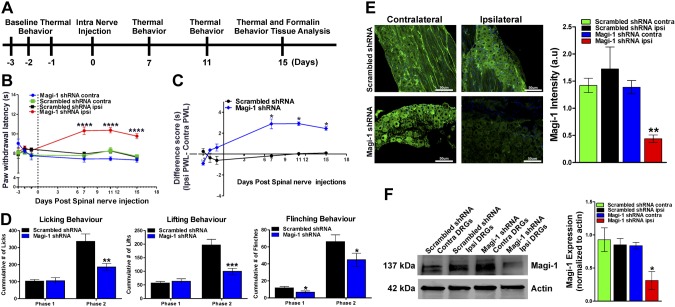
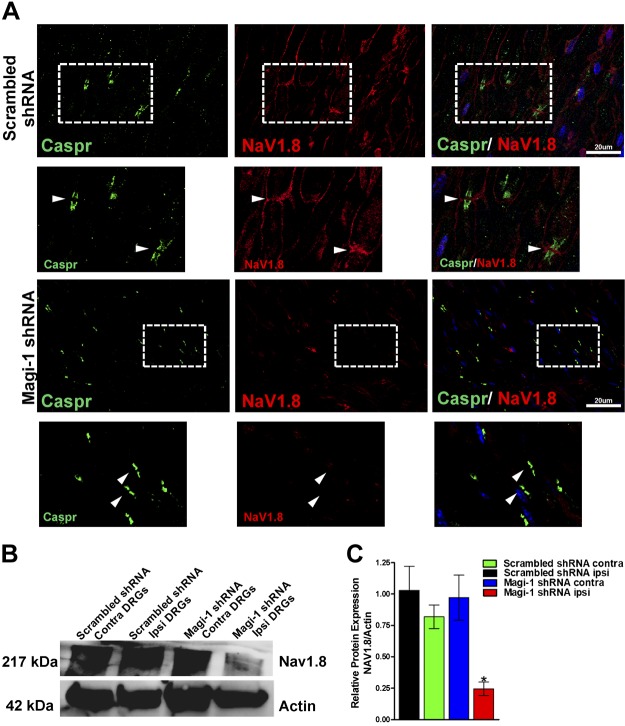
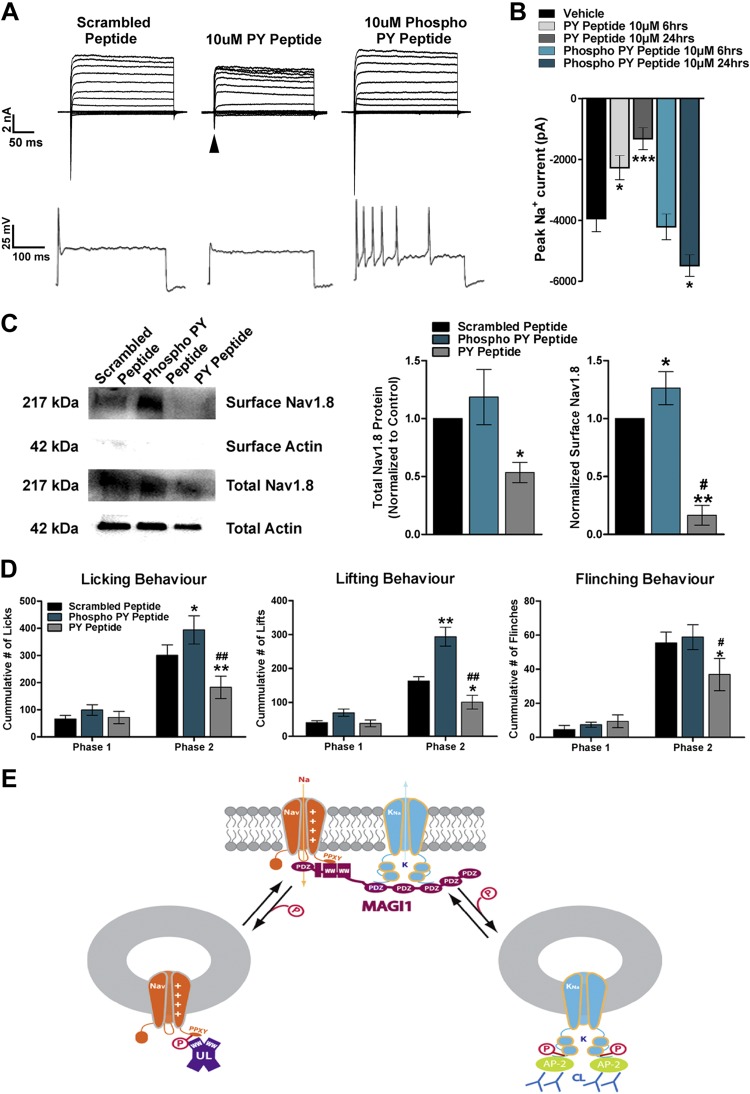
Voltage-dependent sodium (NaV) 1.8 channels regulate action potential generation in nociceptive neurons, identifying them as putative analgesic targets. Here, we show that NaV1.8 channel plasma membrane localization, retention, and stability occur through a direct interaction with the postsynaptic density-95/discs large/zonula occludens-1-and WW domain-containing scaffold protein called membrane-associated guanylate kinase with inverted orientation (Magi)-1. The neurophysiological roles of Magi-1 are largely unknown, but we found that dorsal root ganglion (DRG)-specific knockdown of Magi-1 attenuated thermal nociception and acute inflammatory pain and produced deficits in NaV1.8 protein expression. A competing cell-penetrating peptide mimetic derived from the NaV1.8 WW binding motif decreased sodium currents, reduced NaV1.8 protein expression, and produced hypoexcitability. Remarkably, a phosphorylated variant of the very same peptide caused an opposing increase in NaV1.8 surface expression and repetitive firing. Likewise, in vivo, the peptides produced diverging effects on nocifensive behavior. Additionally, we found that Magi-1 bound to sequence like a calcium-activated potassium channel sodium-activated (Slack) potassium channels, demonstrating macrocomplexing with NaV1.8 channels. Taken together, these findings emphasize Magi-1 as an essential scaffold for ion transport in DRG neurons and a central player in pain.-Pryce, K. D., Powell, R., Agwa, D., Evely, K. M., Sheehan, G. D., Nip, A., Tomasello, D. L., Gururaj, S., Bhattacharjee, A. Magi-1 scaffolds NaV1.8 and Slack KNa channels in dorsal root ganglion neurons regulating excitability and pain.

Keywords: nociception; peptidomimetics; potassium channels; sodium channels; trafficking.


Conflict of interest statement

The authors thank undergraduate students Kimberly Nguyen (State University of New York at Buffalo) and Morgan Paladino (University of Notre Dame, Notre Dame, ID, USA) for scoring the formalin behavior. The authors thank Dr. Wade Sigurdson (Jacobs School of Medicine and Biomedical Sciences, State University of New York at Buffalo) for assistance with microscopy for the immunofluorescence experiments. The authors thank Dr. Elsa Daurignac (Jacobs School of Medicine and Biomedical Research, State University of New York at Buffalo) for critical reading of this manuscript. D.A., K.M.E., D.L.T., and A.B. are also affiliated with the Program for Neuroscience at The State University of New York at Buffalo. This work was supported by the U.S. National Institutes of Health (NIH), National Institute of Neurological Disorders and Stroke Grant NS078184 (to A.B.). The authors declare no conflicts of interest.

Figures

Figure 1
Figure 1
PDZ binding motif regulates KNa channel expression. A) Amino acid alignment of the distal C termini from orthologous Slack subunits (Xenopus, chicken, rat, and human Slack) and the rat Slick subunit. The final 4 evolutionarily conserved amino acids (ETQL) (red) represent a consensus type 1 PDZ motif (X–S/T–X–V/L/I). Green, AP-2 binding site; magenta, putative PKA phosphorylation site; blue, putative PKC phosphorylation site. B) Representative current traces of Slack and mutated Slack channels (Mut) where the PDZ motif was truncated and recombinantly expressed in CHO cells with or without Magi-1 (top). Current density analysis for each experimental condition (bottom). For each experimental condition, currents from 20 to 25 cells were analyzed. Recordings were performed 48 h after transfection. Values are expressed as ± sem. *P < 0.05 vs. respective controls. C) Representative immunoblots from Co-IP between Magi-1 and Slack when recombinantly expressed in CHO cells. D) Co-IP assay of Magi-1 with WT and a mutant Slack variant with a truncated PDZ motif. Truncating the Slack PDZ motif prevented Co-IP with Magi-1. E) Representative immunoblot of surface biotinylation assay from CHO cells coexpressing Magi-1 with Slack or Slack alone (left). Quantification of surface Slack expression is shown on the right. Data was normalized to input to account for transfection efficiency. t6 = 4.276, n = 4 per group, 2-tailed t test. *P < 0.0129. F) Double immunolabeling experiments showing overlapping expression between Magi-1 (green) (Flag antibody) and Slack (red) (top) and Magi-1 (green) (pAb) and Slack (red) (bottom) when coexpressed in CHO cells. Original magnification value, ×20. G) Representative immunoblots of Co-IP assay between Magi-1 and Slack from intact DRG neurons from adult mice. H) Double immunolabeling experiments depicting colocalization between Magi-1 (green) (pAb) and Slack (red) in cultured DRG neurons. Scale bars, 50 μm. IP, Co-Immunoprecipitation; WB, Western Blot.
Figure 2
Figure 2
Magi-1 regulates Slick channels in CHO cells. A) Representative current traces of Slick currents recombinantly expressed with or without Magi-1 in CHO cells (top). Current density analysis of Slick currents for each condition (bottom). A total of 25 cells were analyzed, and values are expressed as ± sem. *P < 0.05 vs. respective controls. B) Immunoblot depicting total increased Slick protein expression during coexpression with Magi-1. Results were taken from 3 independent cultures, and values are expressed as means ± sem (t4 = 6.152, n = 3 cultures per group, 2-tailed t test). **P < 0.0021. C) Immunolabeling of recombinant Slick channels (red) and Magi-1 (green) when expressed alone or in combination in CHO cells. Scale bars, 50 μm.
Figure 3
Figure 3
Magi-1 knockdown decreases ionic currents and excitability in DRG neurons. A) Representative Magi-1 immunolabeling from cultured DRG neurons 3 d after transfection with Magi-1–targeting siRNA and nontargeting scrambled siRNA (left) using a previously validated polyclonal Magi-1 antibody. Quantification of Magi-1 immunoreactivity is shown on the right. The integrated fluorescence intensity was calculated as the product of the area and the mean pixel intensity using Metamorph software. Values from 4 independent DRG neuronal cultures per experimental condition were analyzed. Values are expressed as means ± sem [ANOVA, F(2,11) = 32.25]. Scale bar, 50 μm. ***P < 0.001 vs. respective controls. B) Representative immunoblots depicting Magi-1 expression after siRNA-mediated Magi-1 knockdown. Magi-1 antibodies normally detect multiple splice variants as indicated by the multiple bands observed on Western blot. Quantification of Magi-1 knockdown in DRG neurons (right). Three different cultures per experimental condition were analyzed. Values expressed as means ± sem [ANOVA, F(2,6) = 42.94]. ***P < 0.001 vs. respective controls. C) Representative immunoblots of surface biotinylation from DRG neurons after Magi-1 knockdown (left). Quantification of Slack channel surface expression is shown on the right. Three independent cultures were analyzed, and values are expressed as means ± sem [ANOVA, F(2,6) = 10.84]. **P < 0.01 vs. respective controls. D) Representative current traces of IK in DRG neurons after Magi-1 knockdown (top). A total of 11–12 neurons per experimental condition were analyzed, and values are expressed as means ± sem. *P ≤ 0.05. E) Representative Action Potential (AP) firing from neurons after siRNA-mediated Magi-1 knockdown during suprathreshold current stimulation (400 pA) for 1000 ms, untransduced (10 out of 10), scrambled DRG neurons 12 out of 12 fire 1 AP, whereas 12 out of 18 neurons transfected with Magi-1 siRNA failed to fire a single AP. A.u., arbitrary unit.
Figure 4
Figure 4
Magi-1 knockdown decreases NaV1.8 plasma membrane expression. A) Representative whole-cell voltage clamp current traces of total INa and TTX-resistant INa in cultured DRG neurons 3 d after transfection with Magi-1–targeting siRNA or nontargeting scrambled siRNA. B) Current density analysis of INa with different conditions. Sodium currents in neurons were recorded in either the presence or absence of 250 nM TTX. The total and TTX-resistant INa was significantly reduced after siRNA-mediated Magi-1 knockdown in cultured DRG neurons. A total of 9–12 cells per experimental group were analyzed, and values are expressed as means ± sem. C) Quantification of peak INa and TTX-resistant peak INa (at voltage step −20 mV) after Magi-1 knockdown. A total of 9–12 cells per experimental group were analyzed, and values are expressed as means ± sem [ANOVA, F(3,26) = 66.24]. *P < 0.0106, ***P < 0.001 vs. respective controls (scrambled siRNA with or without TTX). D) Representative immunoblots from surface biotinylation experiments of DRG neurons depicting reduced NaV1.8 surface expression after Magi-1 knockdown (left). Quantification of NaV1.8 surface expression is shown on the right. For quantification, 4 independent DRG cultures per experimental condition were analyzed, and values are expressed as ± sem [ANOVA, F(2,6) = 7.319]. *P < 0.05 vs. respective controls.
Figure 5
Figure 5
Magi-1 is expressed in DRG neurons, the SC, the SN, and at nodes of Ranvier. A) Representative immunoblots depicting Magi-1 expression from intact DRG (left) and SC (right). Untransfected CHO cell lysates were used as the control lane. CHO cells do not endogenously express Magi-1 Supplemental Fig. S1). B) Immunolabeling images showing Magi-1 (green) expression in cultured DRG neurons (panel 1), DRG sections (panel 2 and 3), and the SC (panels 4 and 5) using a previously validated monoclonal antibody. Panels 2 and 4 depict control immunolabeling, stained with secondary antibody only. DAPI (blue) labels all nuclei of cells. Scale bars, 50 μm for DRGs and 200 μm for SCs. C) Double immunolabeling depicting Magi-1 (red) and the paranodal marker Caspr (green) in SN sections (top). Arrows indicate Magi-1 labeling at nodes of Ranvier. Insets represents high-magnification images of Magi-1 immunoreactivity at nodes (bottom). Scale bars, 20 μm (top) and 10 μm (bottom). D) Frequency distribution of Magi-1 in intact DRG neurons of varying cell body size. A total of 735 neurons from 4 mice were analyzed. Neurons larger than 800 μm2 did not show high levels of Magi-1 expression.
Figure 6
Figure 6
Magi-1 complexes NaV1.8 channels with Slack KNa channels in DRG neurons. A) Representative whole immunoblots from Co-IP assays demonstrating binding between Magi-1 and NaV1.8 using intact adult DRG tissue. IP product samples were run in duplicate. The polyclonal Magi-1 antibody also recognized a 50-kDa band during blotting thought to be a degradation product (as per manufacturer’s description). B) Double immunolabeling experiments demonstrate similar localization between Magi-1 (green) and NaV1.8 (red) in cultured DRG neurons (panel 1), intact DRG sections (panel 2), and the spinal cord (panel 3). Scale bars, 50 μm. C) Representative immunoblots of Co-IP between Slack and NaV1.8 from intact adult DRG neurons.
Figure 7
Figure 7
In vivo Magi-1 knockdown attenuates thermal nociception and acute inflammatory pain behavior. A) Experimental timeline before and after Magi-1 knockdown in vivo. B) Hargreaves test for thermal nociception showed increased PWL in ipsilateral paw injected with Magi-1–targeting shRNA when compared with the contralateral paw. No significant difference was seen in PWL between paws in mice injected with nontargeting shRNA. Behavior was taken from 9 different animals (3 females and 6 males) per experimental condition and analyzed (9). Values are expressed as means ± sem. ****P < 0.001 vs. respective controls. C) Difference score analysis determined a ∼3-s difference in withdrawal latency between ipsilateral and contralateral paw after Magi-1 shRNA in vivo transfection (d 7, 11, and 15). Values are expressed as means ± sem. *P < 0.05 vs. control. D) Formalin-induced Phase II inflammatory pain, as measured by 3 nocifensive behaviors [paw licking (left), lifting (middle), and whole-body flinches (right)] in each interval of 5 min, is reduced in mice injected with Magi-1–targeting shRNA after 15 d as compared with controls. Behavior from 9 different animals (n = 9) per experimental condition was analyzed, and values are expressed as means ± sem [ANOVA, licking: F(1,16) = 7.545; lifting: F(1,16) = 11.67; flinching: F(1,16) = 5.007]. *P < 0.05, **P < 0.01, ***P < 0.001 vs. respective controls. E) Representative Magi-1 immunolabeling in DRG sections obtained from 1 mouse injected with Magi-1–targeting shRNA (bottom left) compared with 1 mouse injected with nontargeting scrambled shRNA (top left). Magi-1 immunoreactivity was significantly reduced in ipsilateral paw from mice injected with Magi-1 shRNA as compared with contralateral paw (right). No significant change in immunoreactivity was observed in mice injected with nontargeting scrambled shRNA. DRGs from 3 different animals were analyzed, and values are expressed as means ± sem [ANOVA, F(3,20) = 9.872]. Scale bars, 50 µm. **P < 0.01 vs. respective controls. F) Western blot analysis confirmed Magi-1 knockdown in DRGs 15 d after in vivo transfection of Magi-1–targeting shRNA (left). Quantification of Western blot is shown on the right. Intact DRGs from 3 different animals were analyzed, and values are expressed as means ± sem. [ANOVA, F(3,8) = 5.161]. *P < 0.05 vs. respective controls. A.u., arbitrary unit; contra, contralateral; ipsi, ipsilateral.
Figure 8
Figure 8
NaV1.8 expression decreases after Magi-1 knockdown in vivo. A) Representative immunolabeling of SN depicting NaV1.8 (red) expression in paw injected with nontargeting shRNA after 15 d (top); expression of NaV1.8 at nodes of Ranvier was detected using the paranodal marker Caspr (green). Boxed areas shown are a high-magnification image of NaV1.8 and Caspr immunoreactivity (original magnification value, ×63). NaV1.8 immunoreactivity was absent in SN and at nodes in paw injected with Magi-1–targeting shRNA after 15 d (bottom). Scale bars, 20 µm. B) Representative immunoblots of NaV1.8 expression from ipsilateral and contralateral DRG lysates of mice injected in the SN with nontargeting Magi-1 shRNA (scrambled) or Magi-1–targeting shRNA. Representative blot shown for each condition is taken from the same mice. C) Quantification of NaV1.8 expression is shown on the right. Lumbar DRGs from 3 different animals were analyzed, and values are expressed as ± sem. *P < 0.05 vs. representative controls. Contra, contralateral; ipsi, ipsilateral.
Figure 9
Figure 9
Cell-penetrating WW motif peptidomimetics alter neuronal excitability and affect pain behavior. A) Representative voltage clamp recordings depicting decreased INa (arrow) in cultured DRG neurons after 24 h of pretreatment with the peptide mimetic designated PY peptide, whereas the phospho-PY peptide increasd INa (top). Representative AP traces from cultured DRG neurons pretreated with PY peptide or phospho-PY peptide for 24 h during suprathreshold stimulation (400 pA) for 1000 ms (bottom). B) Peak INa (at voltage step −20 mV) with different peptide treatments in DRG neurons. Neurons were treated for 6 or 24 h with PY peptide or phospho-PY peptide. A total of 10–12 DRG neurons per experimental condition were analyzed, and values are expressed as means ± sem [ANOVA, F(4,35) = 19.11]. *P < 0.05, ***P < 0.001 vs. respective controls. C) NaV1.8 protein expression was altered after peptidomimetic treatment. Representative Western blot of total and surface NaV1.8 membrane expression after DRG neurons were treated with PY peptide, phospho-PY peptide, or a scrambled peptide (left) for 24 h. Quantification of Western blots shown to the right. Treatment with the PY peptide produced a significant reduction of both total and surface NaV1.8 expression when compared with scrambled peptide. The phospho-PY peptide increased surface expression of NaV1.8 when compared with scrambled peptide. Data from 3 independent cultures were analyzed, and values are expressed as means ± sem. *P < 0.05, **P < 0.01 vs. control. #P < 0.01 vs. phospho-PY peptide. D) Phase II formalin inflammatory pain was measured by nocifensive behaviors [paw licking (left), lifting (middle), and whole-body flinches (right)] in each interval of 5 min, is reduced by intraplantar pretreatment (24 h) with 100 μM (20 μl) of PY peptide, whereas phospho-PY peptide increased nocifensive behavioral responses compared with scrambled peptide control. Peptides were administered 24 h before the formalin injection (5%, 25 μl). Behavior from 6 different animals per experimental condition was analyzed, and values are expressed as means ± sem. *P < 0.05, **P < 0.01 vs. controls. #P < 0.05, ##P < 0.01 vs. phospho-PY peptide. E) Magi-1 constitutes the sodium signalosome in DRG neurons. Slack KNa channels were previously shown to internalize by AP2-CME. AP-2, adaptor complex; CL, clathrin.

References

    1. Akopian A. N., Souslova V., England S., Okuse K., Ogata N., Ure J., Smith A., Kerr B. J., McMahon S. B., Boyce S., Hill R., Stanfa L. C., Dickenson A. H., Wood J. N. (1999) The tetrodotoxin-resistant sodium channel SNS has a specialized function in pain pathways. Nat. Neurosci. 2, 541–548 - PubMed
    1. Cummins T. R., Sheets P. L., Waxman S. G. (2007) The roles of sodium channels in nociception: implications for mechanisms of pain. Pain 131, 243–257 - PMC - PubMed
    1. Tibbs G. R., Posson D. J., Goldstein P. A. (2016) Voltage-gated ion channels in the PNS: novel therapies for neuropathic pain? Trends Pharmacol. Sci. 37, 522–542 - PubMed
    1. Vijayaragavan K., Boutjdir M., Chahine M. (2004) Modulation of Nav1.7 and Nav1.8 peripheral nerve sodium channels by protein kinase A and protein kinase C. J. Neurophysiol. 91, 1556–1569 - PubMed
    1. Liu C., Li Q., Su Y., Bao L. (2010) Prostaglandin E2 promotes Na1.8 trafficking via its intracellular RRR motif through the protein kinase A pathway. Traffic 11, 405–417 - PubMed

Publication types

MeSH terms

LinkOut - more resources