

KD025 (SLx-2119) suppresses adipogenesis at intermediate stage in human adipose-derived stem cells
- PMID: 30860936
- PMCID: PMC6768280
- DOI: 10.1080/21623945.2019.1590929
KD025 (SLx-2119) suppresses adipogenesis at intermediate stage in human adipose-derived stem cells
Abstract
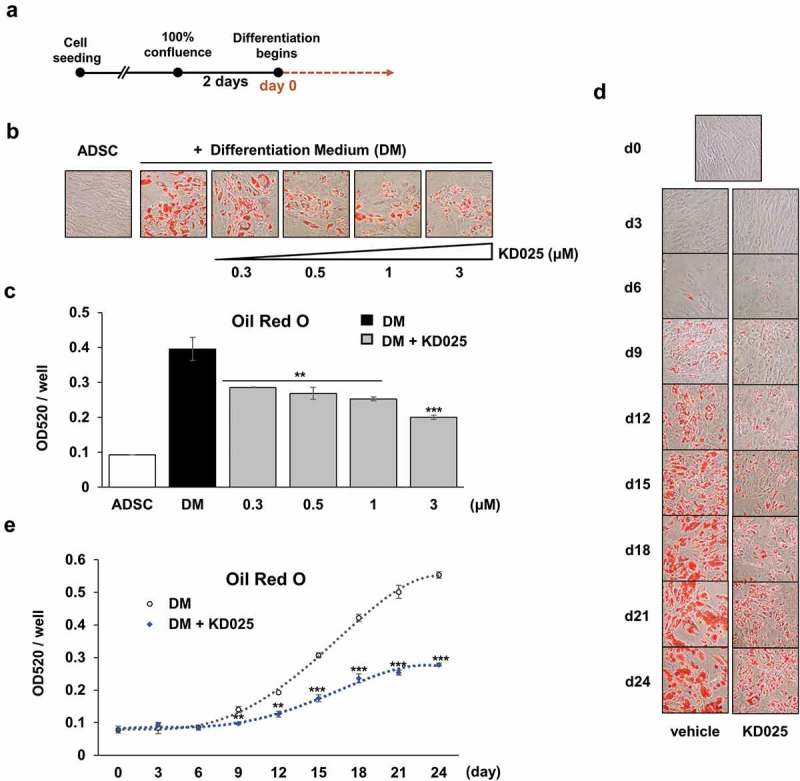
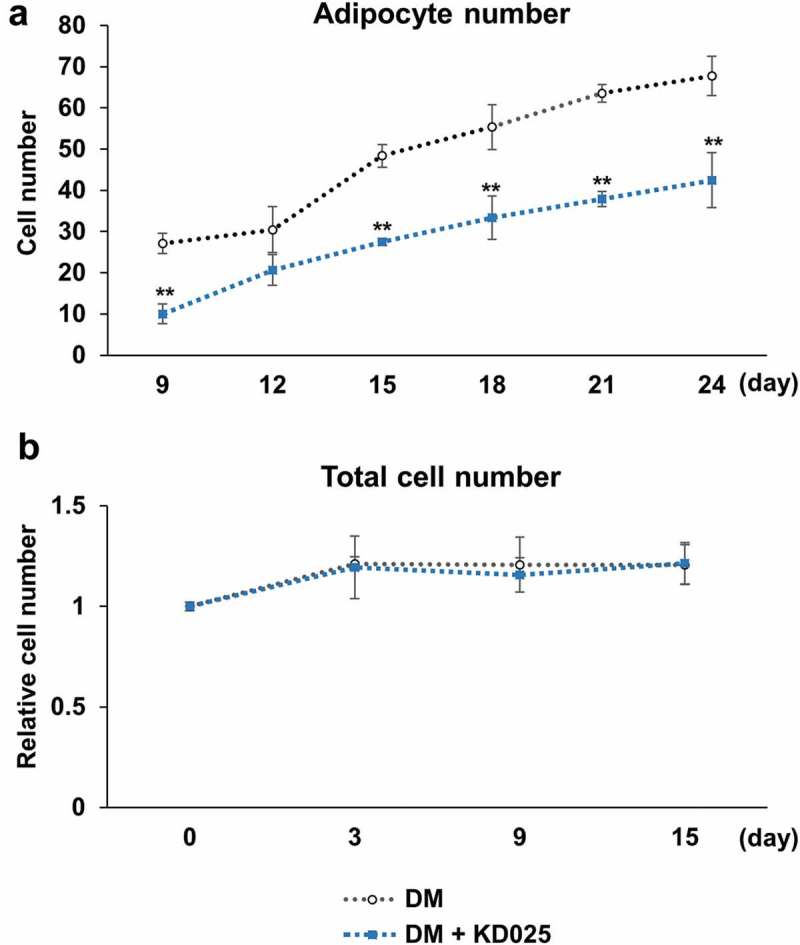
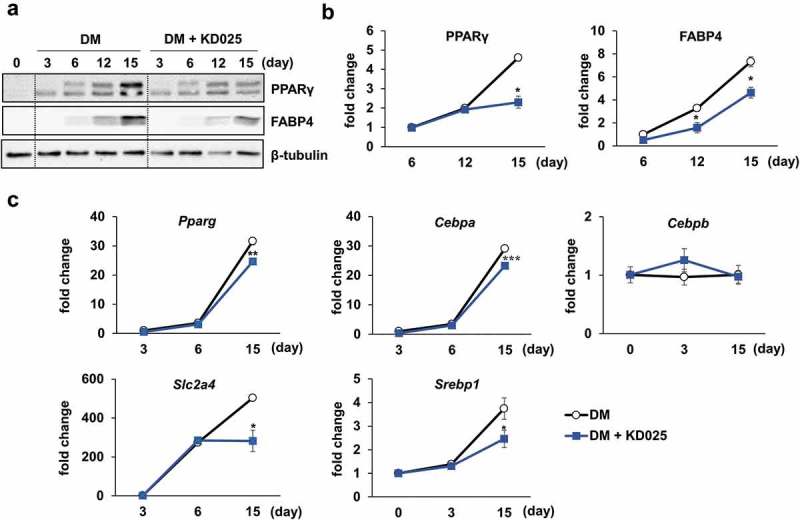
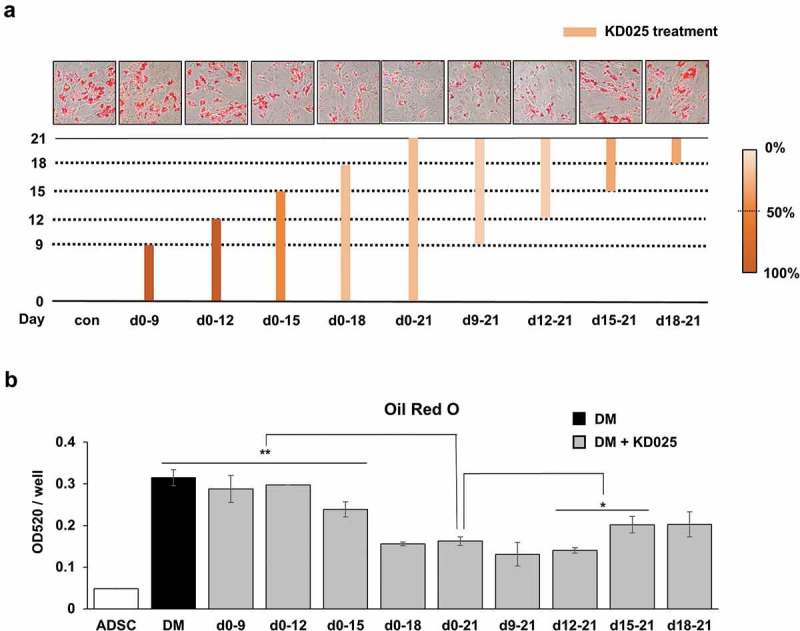
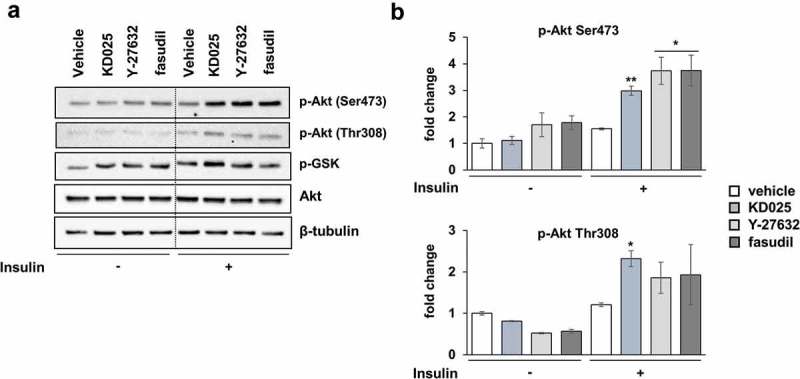
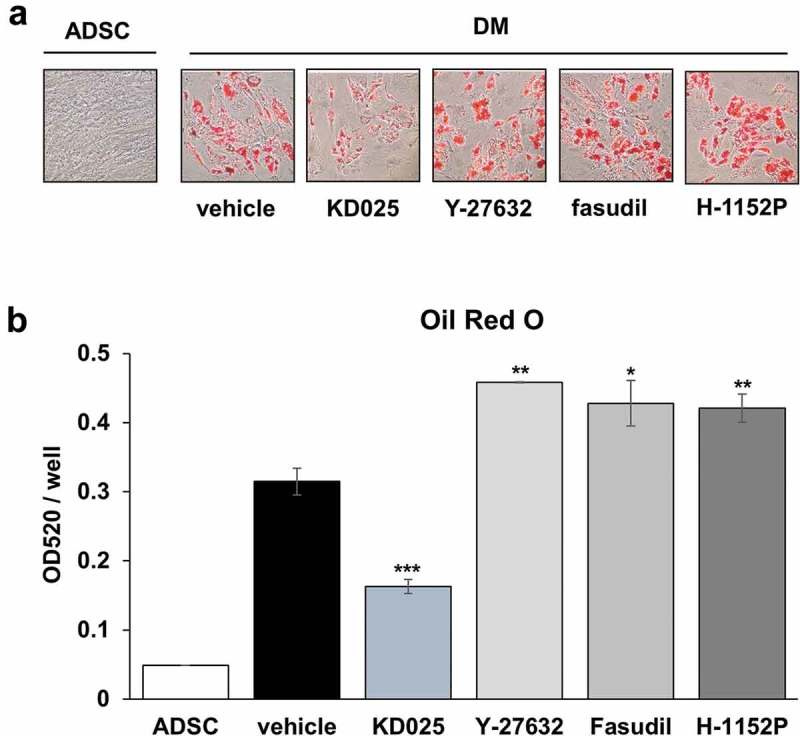
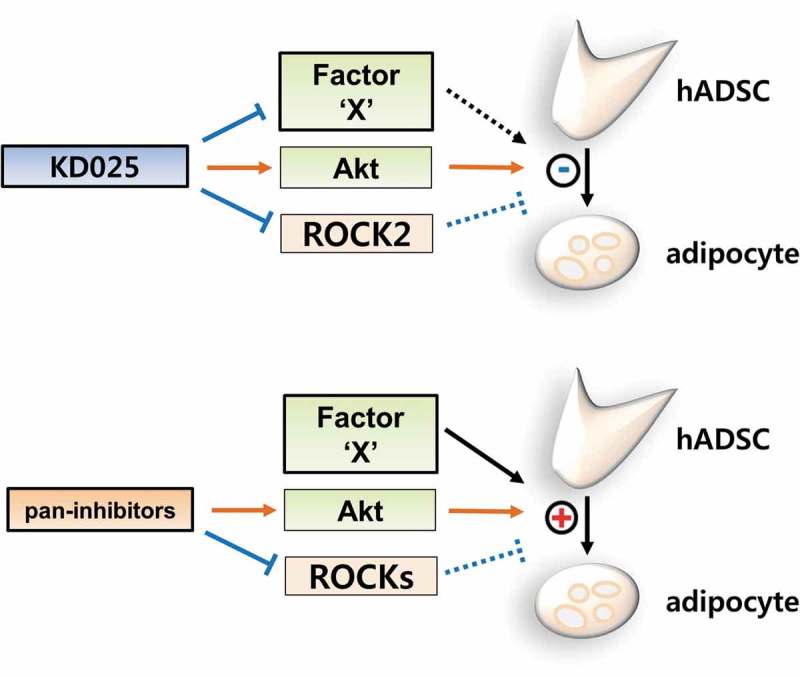
Rho-associated kinases (ROCKs) have been reported to antagonize adipocyte differentiation, and inhibition of ROCKs by small molecules promotes adipogenesis. Surprisingly, our recent study revealed that the ROCK2-specific inhibitor KD025 (SLx-2119), suppresses differentiation at the intermediate stage in 3T3-L1 preadipocytes. To address whether the anti-adipogenic activity of KD025 is a generalizable property, we examined the effect of KD025 in human adipose-derived stem cells (hADSCs). KD025 significantly suppressed the adipocyte differentiation of hADSCs with downregulation of the protein and mRNA expression of various adipogenic and lipogenic markers, including PPARγ, C/EBPα, SREBP-1c, Glut4 and FABP4. Notably, we observed that adipocyte differentiation is effectively suppressed by exposure to KD025 during the mid-to-late period of adipogenesis but not at the earlier stages, showing stage-specificity. Contrary to expectations, KD025 upregulated the insulin signaling, as confirmed by the increased phosphorylation levels of Akt and GSK-3α/β, and the differentiation-promoting activity of insulin signaling was observed to be overwhelmed by the inhibitory activity. In addition, we observed that other ROCK inhibitors (Y-27632, fasudil, and H-1152P) did not suppress but promoted adipocyte differentiation. These results indicate that KD025 suppresses adipocyte differentiation by modulation of key factors activated at the intermediate stage of differentiation, and not by inhibition of ROCK2.
Keywords: KD025; ROCK; Rho-associated kinase; SLx-2119; adipogenesis; differentiation.
Figures
Similar articles
-
Unraveling the rationale and conducting a comprehensive assessment of KD025 (Belumosudil) as a candidate drug for inhibiting adipogenic differentiation-a systematic review.Naunyn Schmiedebergs Arch Pharmacol. 2024 May;397(5):2681-2699. doi: 10.1007/s00210-023-02834-6. Epub 2023 Nov 15. Naunyn Schmiedebergs Arch Pharmacol. 2024. PMID: 37966572
-
Anti-adipogenic effects of KD025 (SLx-2119), a ROCK2-specific inhibitor, in 3T3-L1 cells.Sci Rep. 2018 Feb 6;8(1):2477. doi: 10.1038/s41598-018-20821-3. Sci Rep. 2018. PMID: 29410516 Free PMC article.
-
ROCK2-Specific Inhibitor KD025 Suppresses Adipocyte Differentiation by Inhibiting Casein Kinase 2.Molecules. 2021 Aug 5;26(16):4747. doi: 10.3390/molecules26164747. Molecules. 2021. PMID: 34443331 Free PMC article.
-
α, β-Amyrin, a pentacyclic triterpenoid from Protium heptaphyllum suppresses adipocyte differentiation accompanied by down regulation of PPARγ and C/EBPα in 3T3-L1 cells.Biomed Pharmacother. 2019 Jan;109:1860-1866. doi: 10.1016/j.biopha.2018.11.027. Epub 2018 Nov 26. Biomed Pharmacother. 2019. PMID: 30551441
-
Review: Epigenetic regulation of adipocyte differentiation and adipogenesis.J Zhejiang Univ Sci B. 2010 Oct;11(10):784-91. doi: 10.1631/jzus.B0900401. J Zhejiang Univ Sci B. 2010. PMID: 20872986 Free PMC article. Review.
Cited by
-
Determination of KD025 (SLx-2119), a Selective ROCK2 Inhibitor, in Rat Plasma by High-Performance Liquid Chromatography-Tandem Mass Spectrometry and its Pharmacokinetic Application.Molecules. 2020 Mar 17;25(6):1369. doi: 10.3390/molecules25061369. Molecules. 2020. PMID: 32192179 Free PMC article.
-
KD025 Shifts Pulmonary Endothelial Cell Bioenergetics and Decreases Baseline Lung Permeability.Am J Respir Cell Mol Biol. 2020 Oct;63(4):519-530. doi: 10.1165/rcmb.2019-0435OC. Am J Respir Cell Mol Biol. 2020. PMID: 32628869 Free PMC article.
-
Unraveling the rationale and conducting a comprehensive assessment of KD025 (Belumosudil) as a candidate drug for inhibiting adipogenic differentiation-a systematic review.Naunyn Schmiedebergs Arch Pharmacol. 2024 May;397(5):2681-2699. doi: 10.1007/s00210-023-02834-6. Epub 2023 Nov 15. Naunyn Schmiedebergs Arch Pharmacol. 2024. PMID: 37966572
-
Pan-ROCK and ROCK2 Inhibitors Affect Dexamethasone-Treated 2D- and 3D-Cultured Human Trabecular Meshwork (HTM) Cells in Opposite Manners.Molecules. 2021 Oct 22;26(21):6382. doi: 10.3390/molecules26216382. Molecules. 2021. PMID: 34770791 Free PMC article.
-
Selectivity matters: selective ROCK2 inhibitor ameliorates established liver fibrosis via targeting inflammation, fibrosis, and metabolism.Commun Biol. 2023 Nov 18;6(1):1176. doi: 10.1038/s42003-023-05552-0. Commun Biol. 2023. PMID: 37980369 Free PMC article.
References
-
- Galic S, Oakhill JS, Steinberg GR. Adipose tissue as an endocrine organ. Mol Cell Endocrinol. 2010;316:129–139. - PubMed
-
- Lowe CE, O’Rahilly S, Rochford JJ. Adipogenesis at a glance. J Cell Sci. 2011;124:2681–2686. - PubMed
-
- Rosen ED, MacDougald OA. Adipocyte differentiation from the inside out. Nat Rev Mol Cell Biol. 2006;7:885–896. - PubMed
Publication types
MeSH terms
Substances
LinkOut - more resources
Full Text Sources
Molecular Biology Databases
Research Materials