. 2019 Mar 12;17(3):e2006146.
doi: 10.1371/journal.pbio.2006146. eCollection 2019 Mar.

The histone methyltransferase G9a regulates tolerance to oxidative stress-induced energy consumption

Affiliations

The histone methyltransferase G9a regulates tolerance to oxidative stress-induced energy consumption

Human Riahi et al. PLoS Biol. .

Abstract

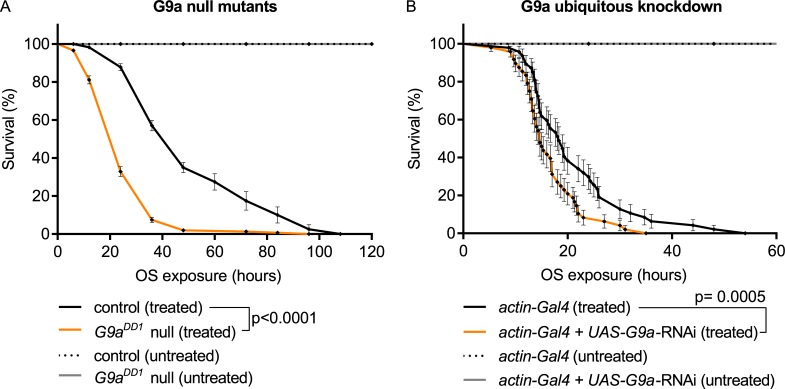
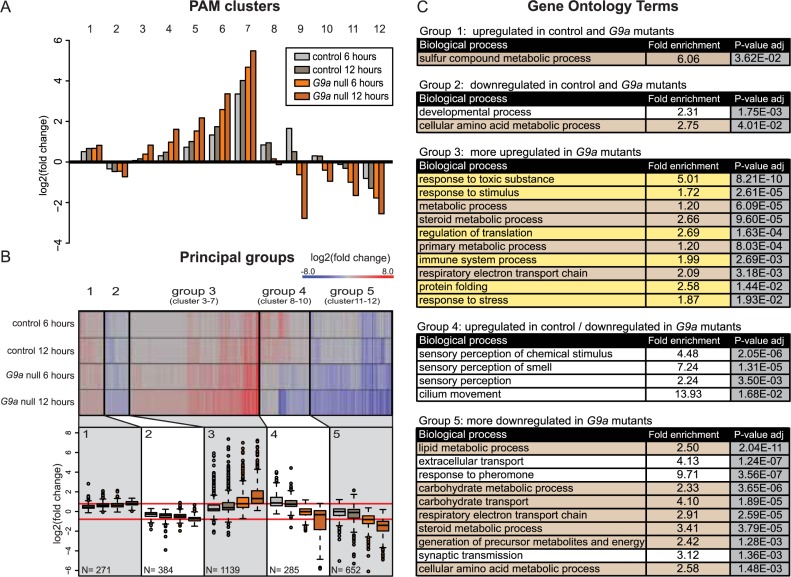
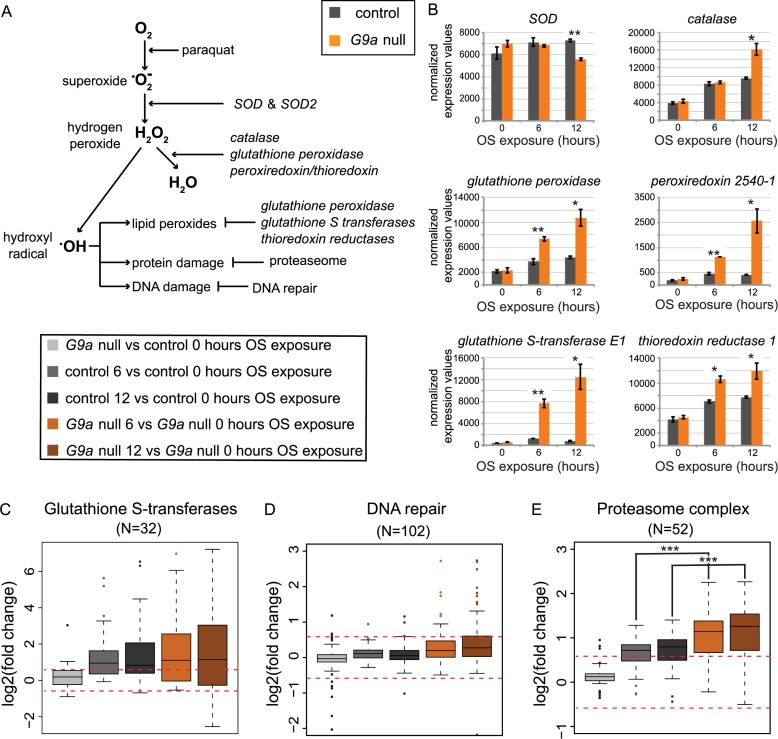
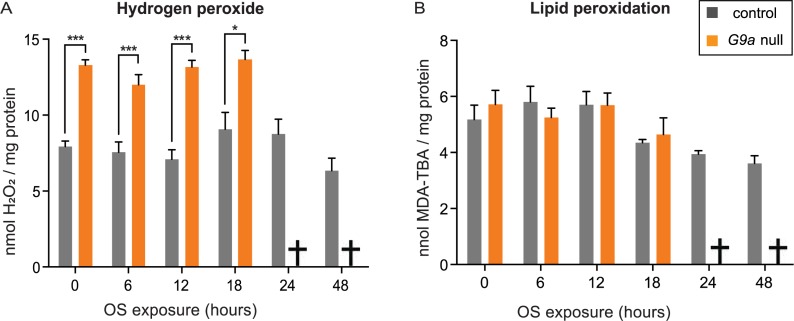
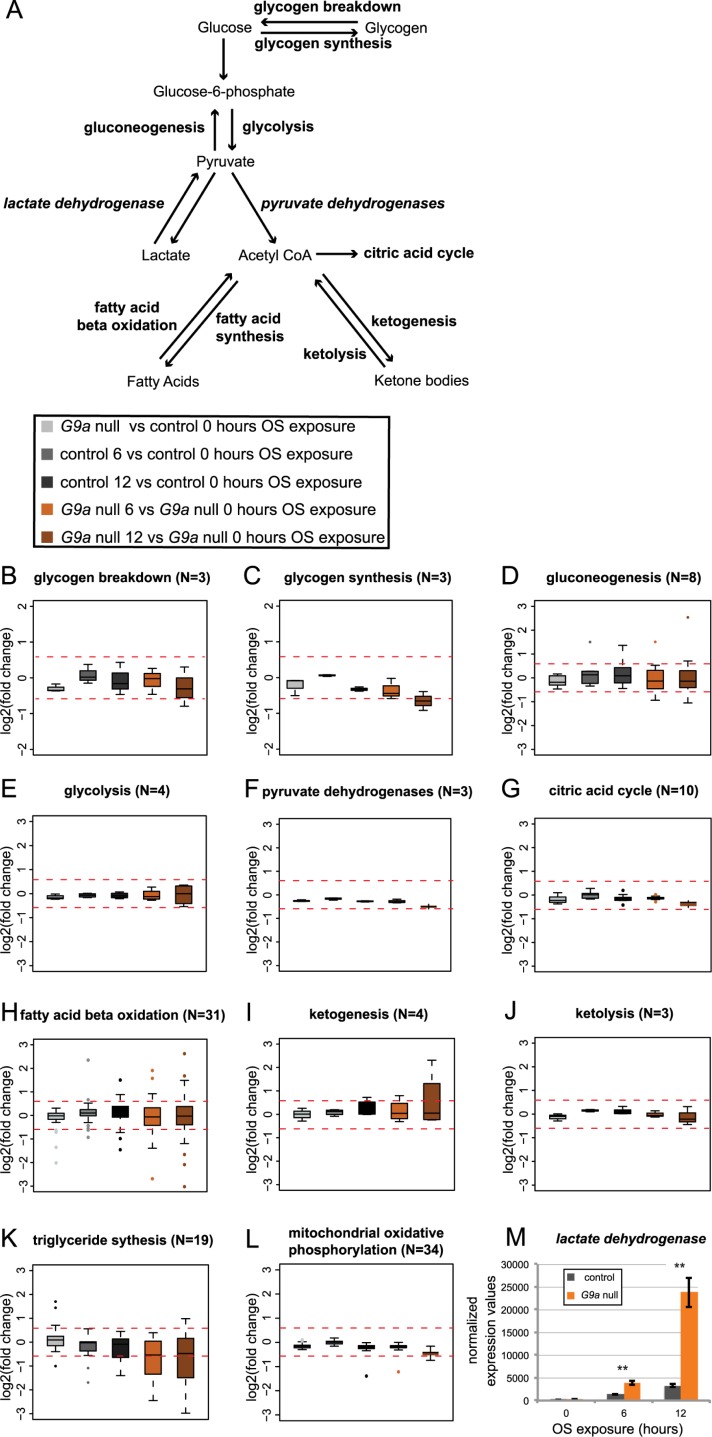
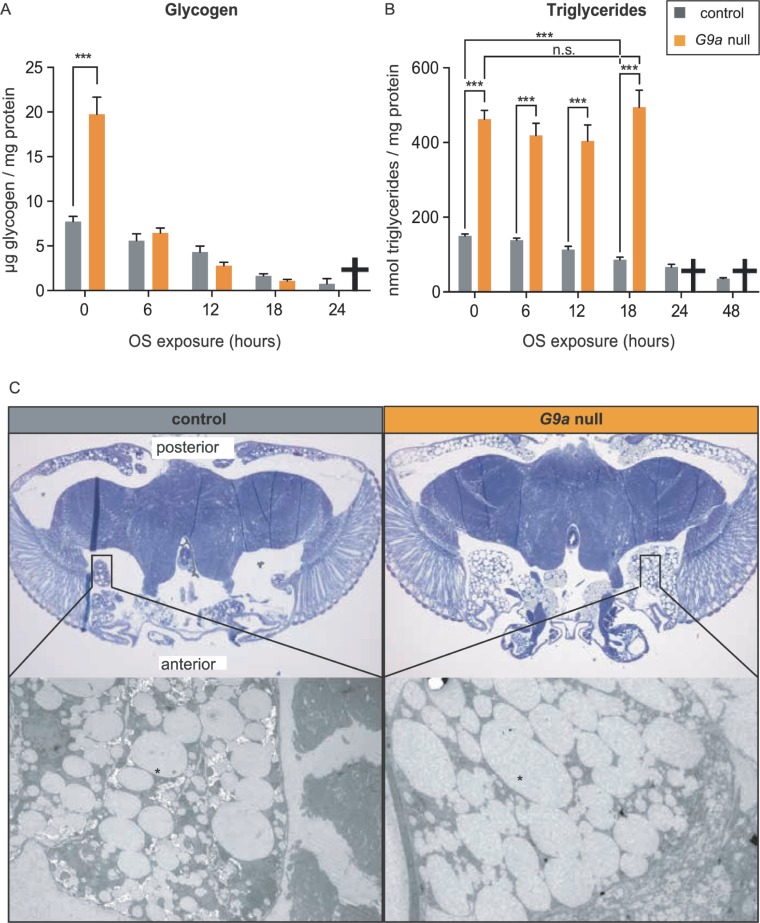
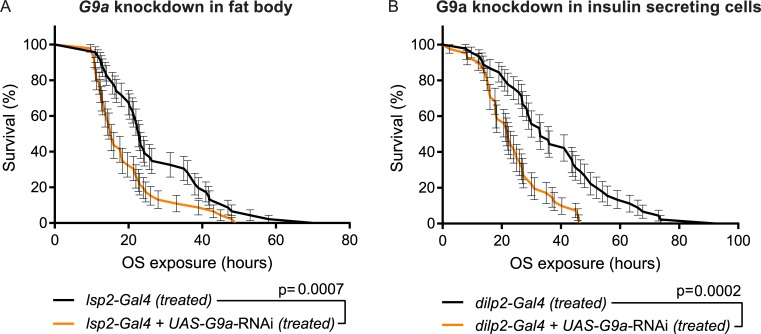
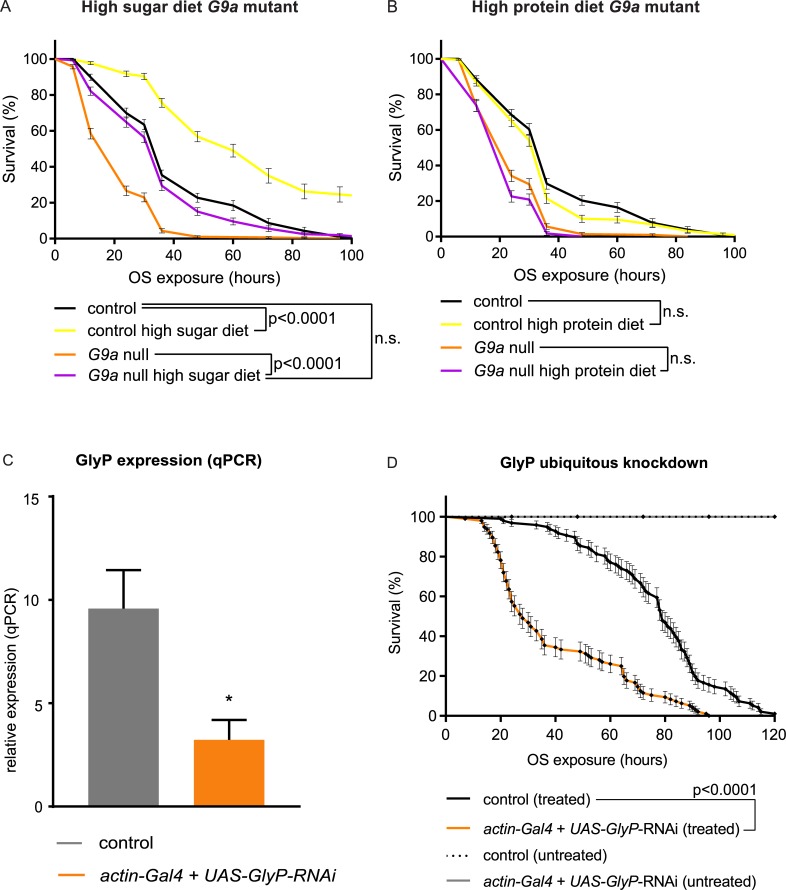
Stress responses are crucial processes that require activation of genetic programs that protect from the stressor. Stress responses are also energy consuming and can thus be deleterious to the organism. The mechanisms coordinating energy consumption during stress response in multicellular organisms are not well understood. Here, we show that loss of the epigenetic regulator G9a in Drosophila causes a shift in the transcriptional and metabolic responses to oxidative stress (OS) that leads to decreased survival time upon feeding the xenobiotic paraquat. During OS exposure, G9a mutants show overactivation of stress response genes, rapid depletion of glycogen, and inability to access lipid energy stores. The OS survival deficiency of G9a mutants can be rescued by a high-sugar diet. Control flies also show improved OS survival when fed a high-sugar diet, suggesting that energy availability is generally a limiting factor for OS tolerance. Directly limiting access to glycogen stores by knocking down glycogen phosphorylase recapitulates the OS-induced survival defects of G9a mutants. We propose that G9a mutants are sensitive to stress because they experience a net reduction in available energy due to (1) rapid glycogen use, (2) an inability to access lipid energy stores, and (3) an overinduced transcriptional response to stress that further exacerbates energy demands. This suggests that G9a acts as a critical regulatory hub between the transcriptional and metabolic responses to OS. Our findings, together with recent studies that established a role for G9a in hypoxia resistance in cancer cell lines, suggest that G9a is of wide importance in controlling the cellular and organismal response to multiple types of stress.


Conflict of interest statement

The authors have declared that no competing interests exist.

Figures

Fig 1
Fig 1. G9a is required for resistance to paraquat-induced OS.
(A) Survival curves of G9a-null mutants and controls upon paraquat-induced OS exposure (treated) show reduced survival in G9aDD1 mutants (median survival time: G9aDD1 mutants, treated: 24 h, n = 324; versus control, treated, 48 h, n = 330; p < 0.0001). G9a mutants and controls show normal longevity without OS exposure (untreated) during the time course of the experiment (G9aDD1, untreated n = 632; control, untreated n = 697). (B) Survival curves of G9a ubiquitous knockdown flies show reduced survival upon OS exposure (actin-Gal4 + UAS-G9a-RNAi, treated) compared to the controls (actin-Gal4, treated) (median survival time: actin-Gal4 + UAS-G9a-RNAi, treated, 14 h, n = 48 versus actin-Gal4, treated, 18 h, n = 48; p = 0.007) and normal longevity when untreated. The ubiquitously expressed actin driver was combined with a UAS-G9a RNAi construct (actin-Gal4 + UAS-G9a-RNAi) to knock down G9a expression or crossed to the isogenic background of the RNAi construct to generate the isogenic control (actin-Gal4). Survival curves showing percent survival over time and SE were plotted using Graphpad, and p-values were obtained using the Gehan-Breslow-Wilcoxon statistical test. All experiments were independently replicated at least three times. The numerical data depicted in this figure can be found in S5 Data. OS, oxidative stress; RNAi, RNA interference; SE, standard error.
Fig 2
Fig 2. G9a mutants show highly augmented transcriptional response of genes regulating stress defenses and metabolism.
(A) PAM clustering of differentially expressed genes base on log2 fold change values obtained from differential expression analysis in four pairwise comparisons. (B) Heatmap and boxplots of log2 fold changes of differentially expressed genes combined into five principle groups derived from clusters with similar patterns of differential expression. The five principle groups show up-regulation in G9a mutants and controls (group 1, cluster 1), down-regulation in G9a mutants and controls (group 2, cluster 2), more up-regulation in G9a mutants compared to controls (group 3, clusters 3–7), up-regulated in controls and down-regulated in G9a mutants (group 4, clusters 8–10), and more down-regulation in G9a mutants than in controls (group 5, clusters 11 and 12). The number of genes in each group is indicated. (C) Gene ontology analysis showing the top enriched biological processes sorted by adjusted (Bonferroni-corrected) p-value in each of the five principal groups, indicating enrichment in stress response genes (highlighted in yellow) and metabolic genes (highlighted in brown). The numerical data depicted in this figure can be found in S5 Data. PAM, partitioning around medoids.
Fig 3
Fig 3. Enhanced expression of antioxidant and ROS damage pathway genes in G9a mutants upon OS exposure.
(A) Schematic diagram of enzymes crucial for ROS elimination and prevention of ROS-mediated damage. (B) Normalized expression values for selected genes involved in ROS elimination and ROS-mediated damage in G9a mutants and controls at 0, 6, and 12 h after OS induction. Significance was determined using Student t test. (C–E) Boxplots showing log2 fold changes for selected groups of genes encoding glutathione S-transferases, peroxisomal proteins, and the DNA repair machinery. Fold changes were derived from the following pairwise comparisons: G9a mutant versus control after 0 h OS (light gray), control 0 versus 6 (dark gray) and 12 h (black) of OS, and G9a mutant 0 versus 6 (orange) and 12 h (brown) of OS. Statistical comparisons between groups were performed using a Wilcoxon signed-rank test. ***p < 0.001; **p < 0.01; *p < 0.05. The numerical data depicted in this figure can be found in S5 Data. H2O2, hydrogen peroxide; OS, oxidative stress; ROS, reactive oxygen species; SOD, superoxide dismutase.
Fig 4
Fig 4. No accumulation of ROS or ROS-mediated damage during OS exposure in G9a mutants and controls.
(A) Hydrogen peroxide and (B) lipid peroxidation levels in G9a mutants and controls over a time course of OS exposure. Measurements could not be obtained for the G9a mutants at 24 and 48 h time points, as most flies were already dead (indicated by cross). Bar graphs showing mean values and SEM were generated using Graphpad, and p-values were obtained using multiple t tests with FDR correction. ***p < 0.001; *p < 0.05. The numerical data depicted in this figure can be found in S5 Data. FDR, false discovery rate; OS, oxidative stress; ROS, reactive oxygen species; MDA, malondialdehyde.
Fig 5
Fig 5. Altered expression of metabolic enzymes regulating energy storage and release in G9a mutants upon OS exposure.
(A) Simplified schematic diagram of energy metabolism. (B-L) Boxplots showing log2 fold changes for selected groups of genes encoding enzymes involved in glycogen breakdown (B), glycogen synthesis (C), gluconeogenesis (D), glycolysis (E), pyruvate dehydrogenases (F), citric acid cycle (G), fatty acid beta oxidation (H), ketogenesis (I), ketolysis (J), triglyceride synthesis (K), and mitochondrial oxidative phosphorylation (L). Fold changes were derived from the following pairwise comparisons: G9a mutant versus control after 0 h OS (light gray), control 0 h versus 6 h (dark gray) and 12 h (black) of OS, and G9a mutant 0 h versus 6 h (orange) and 12 h (brown) of OS. (M) Normalized expression values for lactate dehydrogenase. p-Values were obtained using a Student t test. **p < 0.01. The numerical data depicted in this figure can be found in S5 Data. OS, oxidative stress.
Fig 6
Fig 6. Altered energy stores and accelerated energy consumption in G9a mutants during OS exposure.
(A) Glycogen and (B) triglyceride levels in G9a mutants and controls over a time course of OS exposure. Bar graphs showing mean values and SEMs were generated using Graphpad, and p-values were obtained using multiple t tests with FDR correction. ***p < 0.001; n.s., p > 0.05. Metabolites could not be measured for the G9a mutants at 24 and 48 h time points, as the vast majority of flies had died (indicated by a cross). (C) Images from toluidine blue–stained sections of G9a mutant and controls heads obtained using bright-field 10× magnification (top) and scanning electron (bottom) microscopy. Fat body tissues (black rectangle) lateral anterior and posterior are enlarged in G9a mutants. Electron microscopy sections show lipid droplets (indicated by star), which are larger in G9a mutants than in controls. The numerical data depicted in this figure can be found in S5 Data. FDR, false discovery rate; n.s., not significant; OS, oxidative stress.
Fig 7
Fig 7. Tissue-specific requirement for G9a in OS response.
Kaplan-Meier survival curves comparing G9a-knockdown flies to controls. Knockdown was targeted to (A) fat body and (B) dilp2-expressing cells. (A) Survival curves of flies with fat body–specific G9a knockdown (lsp2-Gal4 + UAS-G9a-RNAi) and controls (lsp2-Gal4) (median survival time: lsp2-Gal4 + UAS-G9a-RNAi, 15 h, n = 46 versus lsp2-Gal4, 23 h, n = 46; p = 0.0007). (B) Survival curves of flies with insulin-secreting cell-specific G9a knockdown (dilp2-Gal4 + UAS-G9a-RNAi) and controls (dilp2-Gal4) (median survival time: dilp2-Gal4 + UAS-G9a-RNAi, 22 h, n = 41 versus dilp2-Gal4, 33 h, n = 45; p = 0.0002). Fat body–or insulin-secreting cell–specific drivers were combined with a UAS-G9a RNAi construct (lsp2-Gal4 + UAS-G9a-RNAi [A], dilp2-Gal4 + UAS-G9a RNAi [B]) to repress G9a expression in a tissue/cell-specific manner or crossed to the isogenic background of the RNAi lines to generate the isogenic controls. Survival curves showing percent survival and SE over time were plotted using Graphpad, and p-values were obtained using the Gehan-Breslow-Wilcoxon test. All experiments were independently replicated at least three times. The numerical data depicted in this figure can be found in S5 Data. OS, oxidative stress; RNAi, RNA interference; SE, standard error.
Fig 8
Fig 8. OS-mediated survival defects of G9a mutants can be rescued by a high-sugar diet and are recapitulated by inhibition of glycogen breakdown.
(A, B) Survival curves of G9a mutants and controls fed or not with a high-sugar (A) or high-protein (B) diet during OS exposure. (C) GlyP relative expression in ubiquitous GlyP-knockdown flies (actin-Gal4 + UAS-GlyP-RNAi) and controls (actin-Gal4), as determined by qPCR. To generate these flies, the ubiquitously expressed actin driver was combined with a UAS-GlyP RNAi construct (actin-Gal4 + UAS-GlyP-RNAi) to knock down GlyP expression or crossed to the isogenic background of the RNAi construct to generate the isogenic control (actin-Gal4). (D) Survival curves of GlyP ubiquitous knockdown flies and controls (actin-Gal4, treated) upon paraquat-induced OS (treated) or untreated. Genotypes are as in (C). Median survival time actin-Gal4 + UAS-GlyP-RNAi (treated): 28 h, n = 96 versus actin-Gal4 (treated) 79 h, n = 96; p < 0.0001. Survival curves showing percent survival and SE over time were plotted using Graphpad, and p-values were obtained using the Gehan-Breslow-Wilcoxon test. The numerical data depicted in this figure can be found in S5 Data. GlyP, glycogen phosphorylase; n.s., not significant; OS, oxidative stress; qPCR, quantitative PCR; RNAi, RNA interference; SE, standard error.

Comment in

References

    1. Kültz D. Molecular and evolutionary basis of the cellular stress response. Annu Rev Physiol. 2005;67(1):225–57. - PubMed
    1. Baena-González E. Energy signaling in the regulation of gene expression during stress. Molecular Plant. 2010;3(2):300–13. 10.1093/mp/ssp113 - DOI - PubMed
    1. Chambers MC, Song KH, Schneider DS. Listeria monocytogenes Infection Causes Metabolic Shifts in Drosophila melanogaster. PLoS ONE. 2012;7(12):e50679 10.1371/journal.pone.0050679 - DOI - PMC - PubMed
    1. Shenton D, Smirnova JB, Selley JN, Carroll K, Hubbard SJ, Pavitt GD, et al. Global translational responses to oxidative stress impact upon multiple levels of protein synthesis. J Biol Chem. 2006;281(39):29011–21 10.1074/jbc.M601545200 - DOI - PubMed
    1. Kourtis N, Tavernarakis N. Cellular stress response pathways and ageing: intricate molecular relationships. EMBO J. 2011;30(13):2520–31. 10.1038/emboj.2011.162 - DOI - PMC - PubMed

Publication types

MeSH terms