

Microplastics in freshwaters and drinking water: Critical review and assessment of data quality
- PMID: 30861380
- PMCID: PMC6449537
- DOI: 10.1016/j.watres.2019.02.054
Microplastics in freshwaters and drinking water: Critical review and assessment of data quality
Abstract
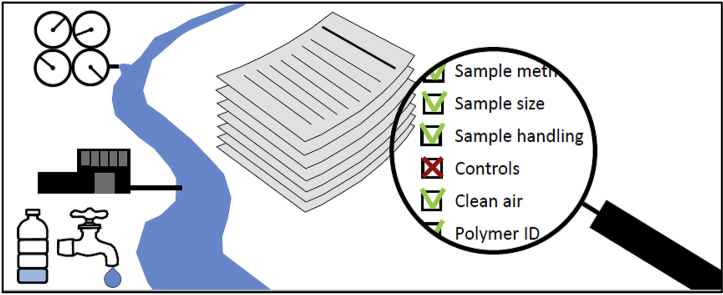
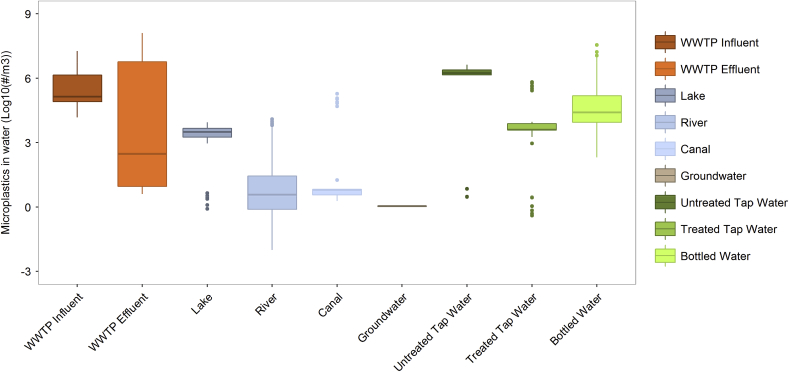
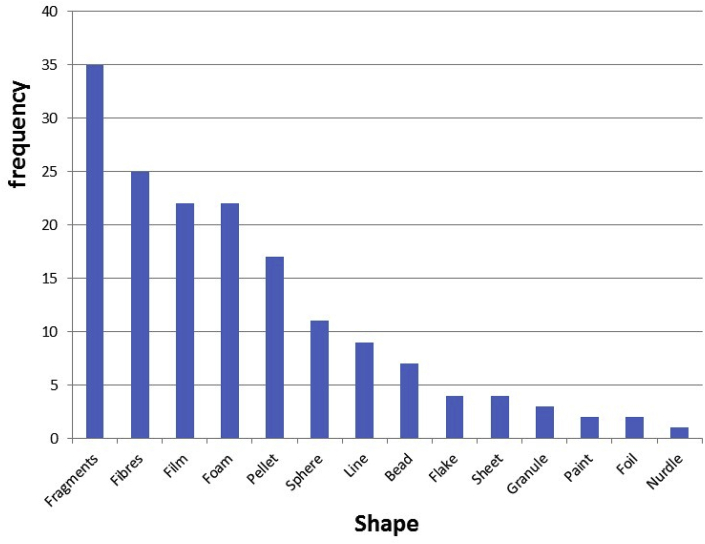
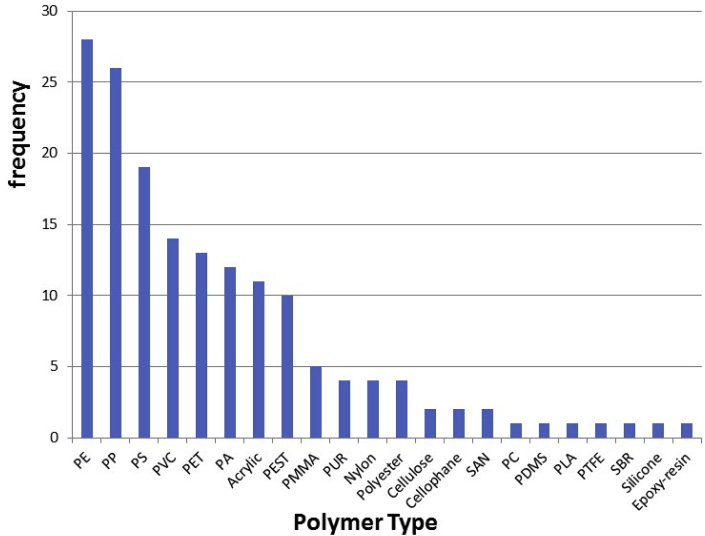
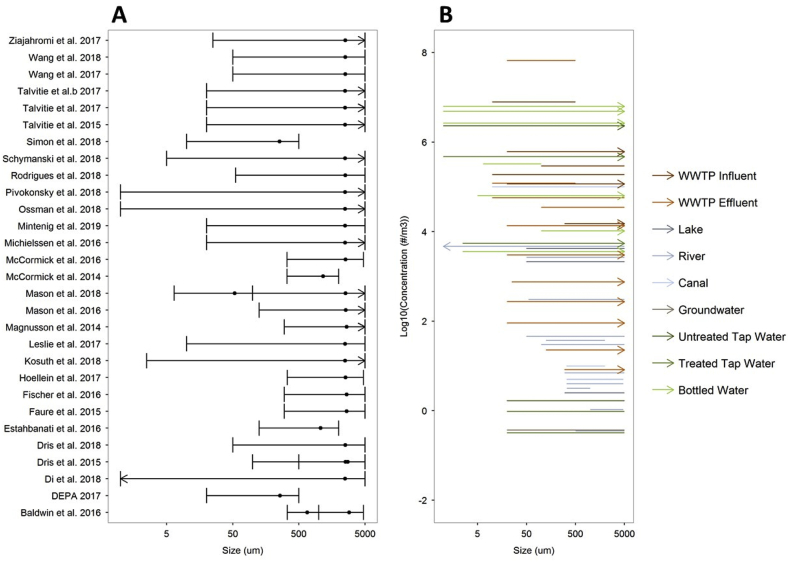
Microplastics have recently been detected in drinking water as well as in drinking water sources. This presence has triggered discussions on possible implications for human health. However, there have been questions regarding the quality of these occurrence studies since there are no standard sampling, extraction and identification methods for microplastics. Accordingly, we assessed the quality of fifty studies researching microplastics in drinking water and in its major freshwater sources. This includes an assessment of microplastic occurrence data from river and lake water, groundwater, tap water and bottled drinking water. Studies of occurrence in wastewater were also reviewed. We review and propose best practices to sample, extract and detect microplastics and provide a quantitative quality assessment of studies reporting microplastic concentrations. Further, we summarize the findings related to microplastic concentrations, polymer types and particle shapes. Microplastics are frequently present in freshwaters and drinking water, and number concentrations spanned ten orders of magnitude (1 × 10⁻² to 108 #/m3) across individual samples and water types. However, only four out of 50 studies received positive scores for all proposed quality criteria, implying there is a significant need to improve quality assurance of microplastic sampling and analysis in water samples. The order in globally detected polymers in these studies is PE ≈ PP > PS > PVC > PET, which probably reflects the global plastic demand and a higher tendency for PVC and PET to settle as a result of their higher densities. Fragments, fibres, film, foam and pellets were the most frequently reported shapes. We conclude that more high quality data is needed on the occurrence of microplastics in drinking water, to better understand potential exposure and to inform human health risk assessments.
Keywords: Drinking water; Human health; Microplastics; Surface water; Waste water.
Copyright © 2019. Published by Elsevier Ltd.
Figures
References
-
- Anderson P.J., Warrack S., Langen V., Challis J.K., Hanson M.L., Rennie M.D. Microplastic contamination in lake Winnipeg, Canada. Environ. Pollut. 2017;225:223–231. - PubMed
-
- Andrady A.L. Microplastics in the marine environment. Mar. Pollut. Bull. 2011;62(8):1596–1605. - PubMed
-
- Baldwin A.K., Corsi S.R., Mason S.A. Plastic debris in 29 Great Lakes tributaries: relations to watershed attributes and hydrology. Environ. Sci. Technol. 2016;50(19):10377–10385. - PubMed
-
- Bergmann M., Gutow L., Klages M. Springer; 2015. Marine Anthropogenic Litter.
-
- Bond T., Ferrandiz-Mas V., Felipe-Sotelo M., van Sebille E. The occurrence and degradation of aquatic plastic litter based on polymer physicochemical properties: a review. Crit. Rev. Environ. Sci. Technol. 2018:1–38.
Publication types
MeSH terms
Substances
Grants and funding
LinkOut - more resources
Full Text Sources
Other Literature Sources
Medical
Miscellaneous
