. 2019 Mar 11;11(3):346.
doi: 10.3390/cancers11030346.

Novel Molecular Characterization of Colorectal Primary Tumors Based on miRNAs

Affiliations

Novel Molecular Characterization of Colorectal Primary Tumors Based on miRNAs

Elisa Conde Moreno et al. Cancers (Basel). .

Abstract

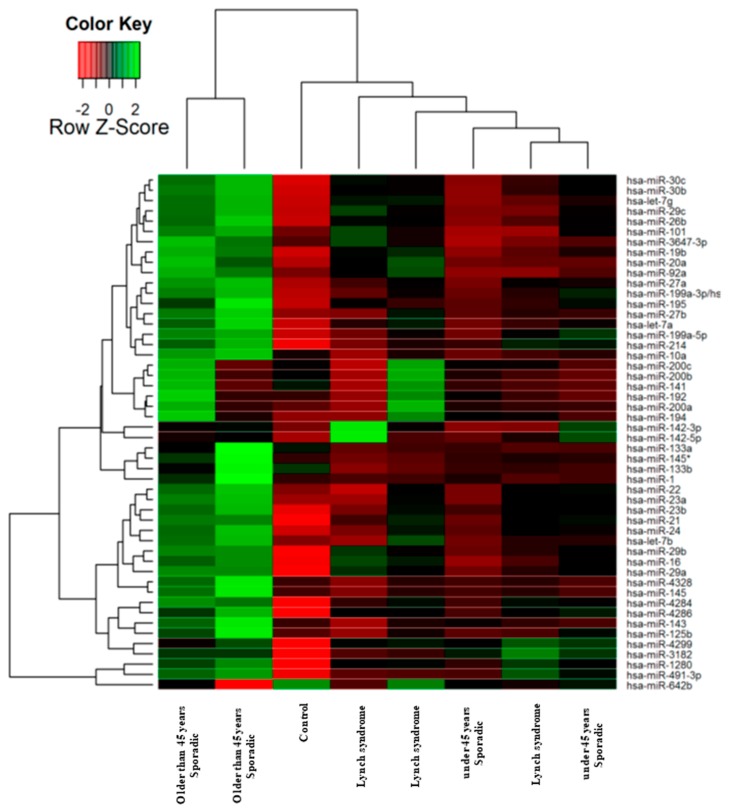
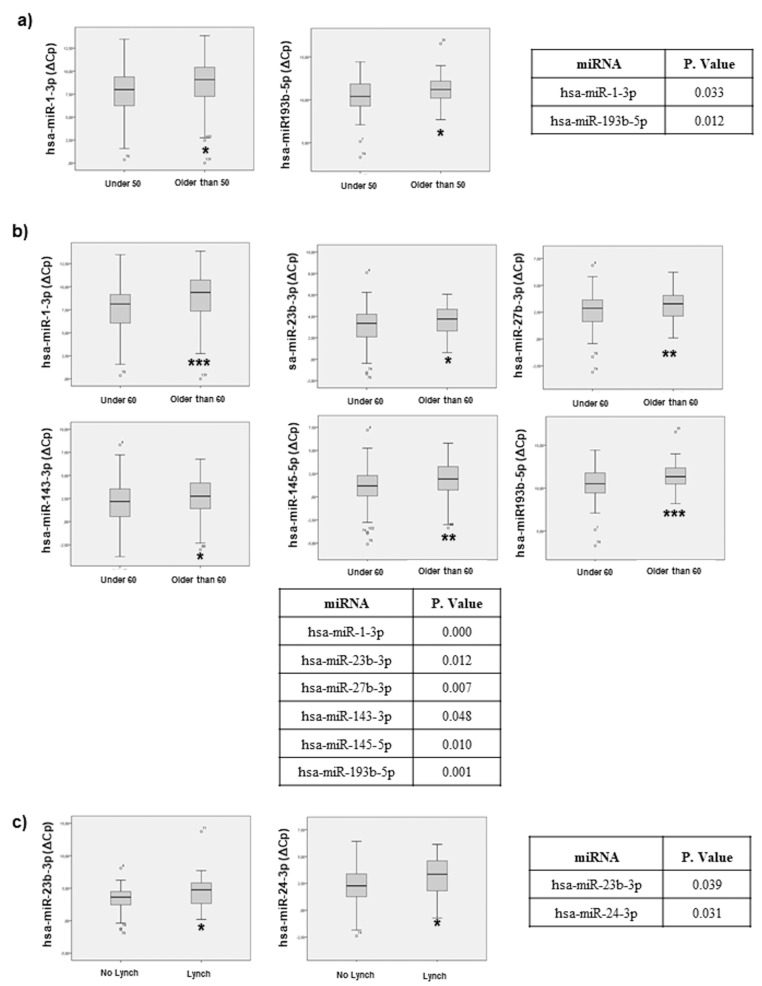
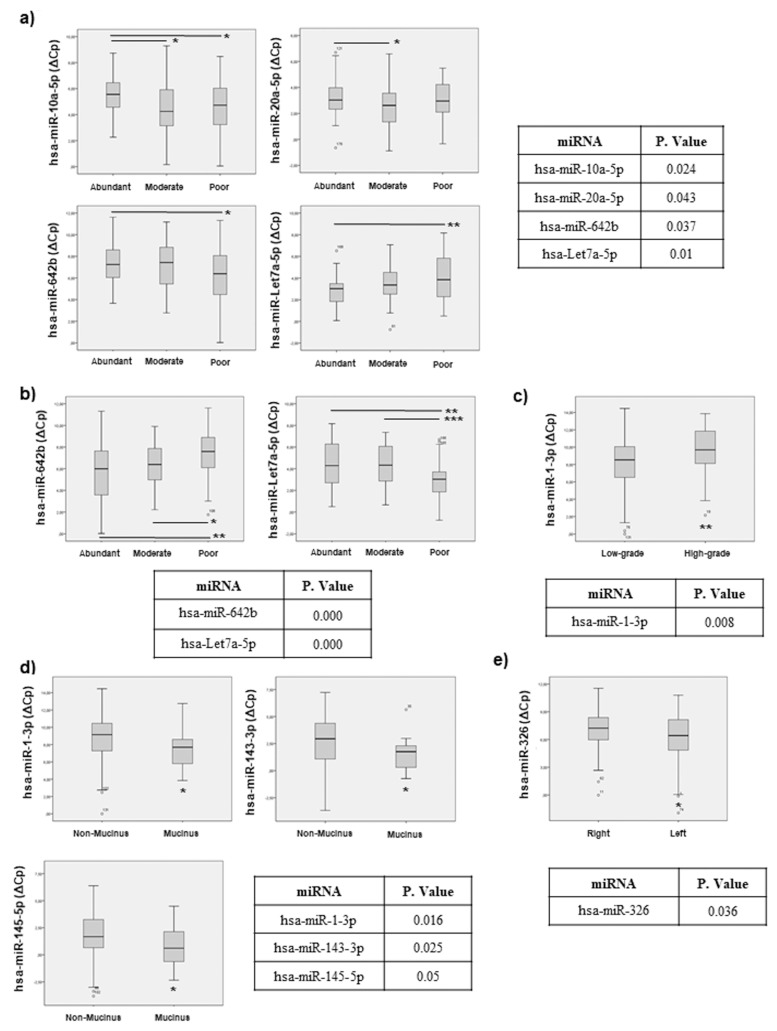
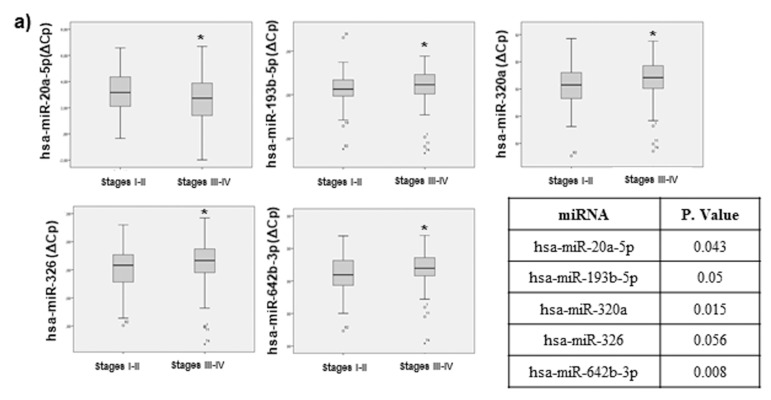
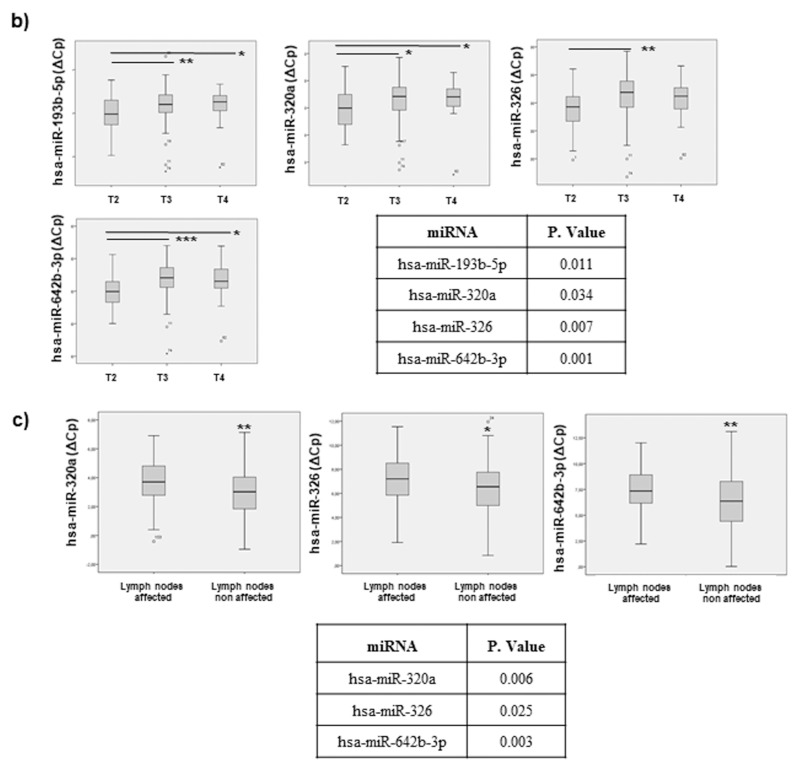
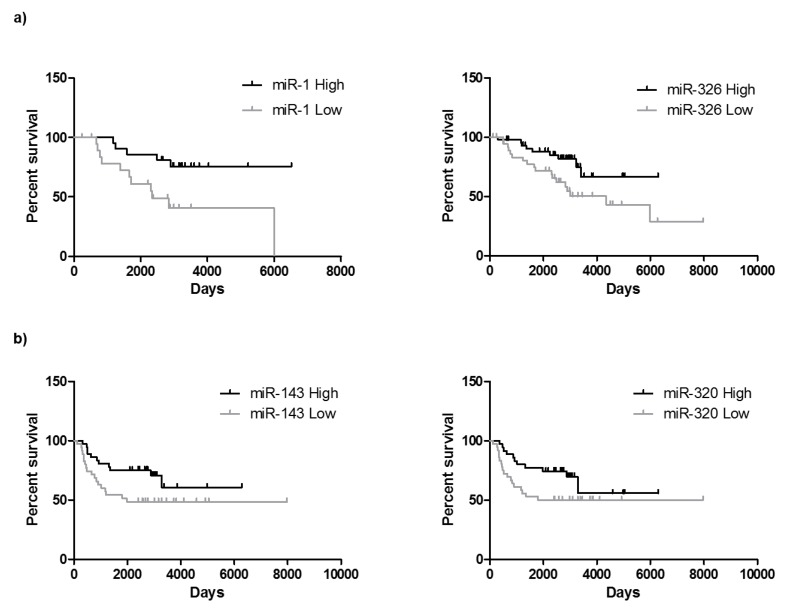
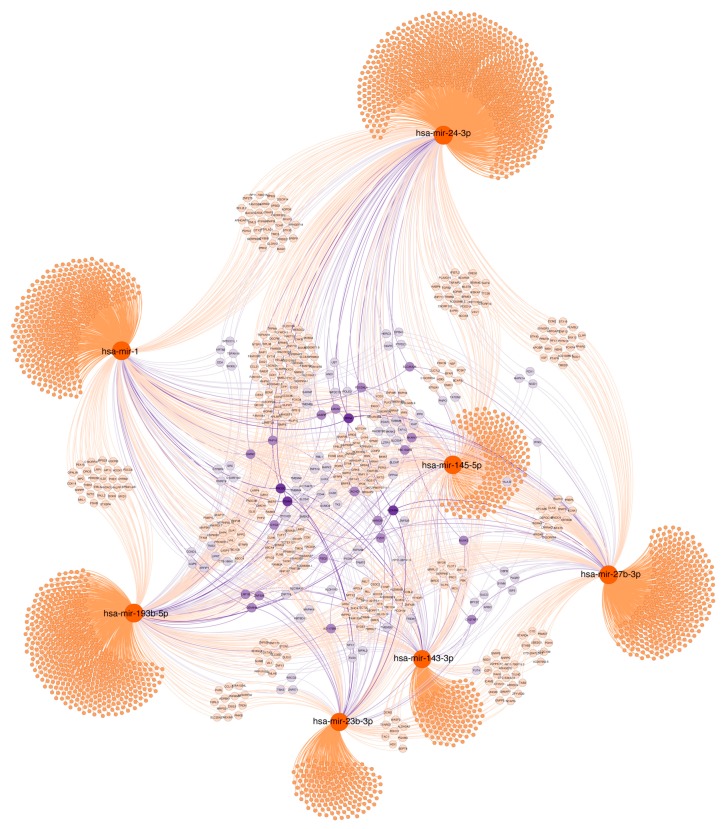
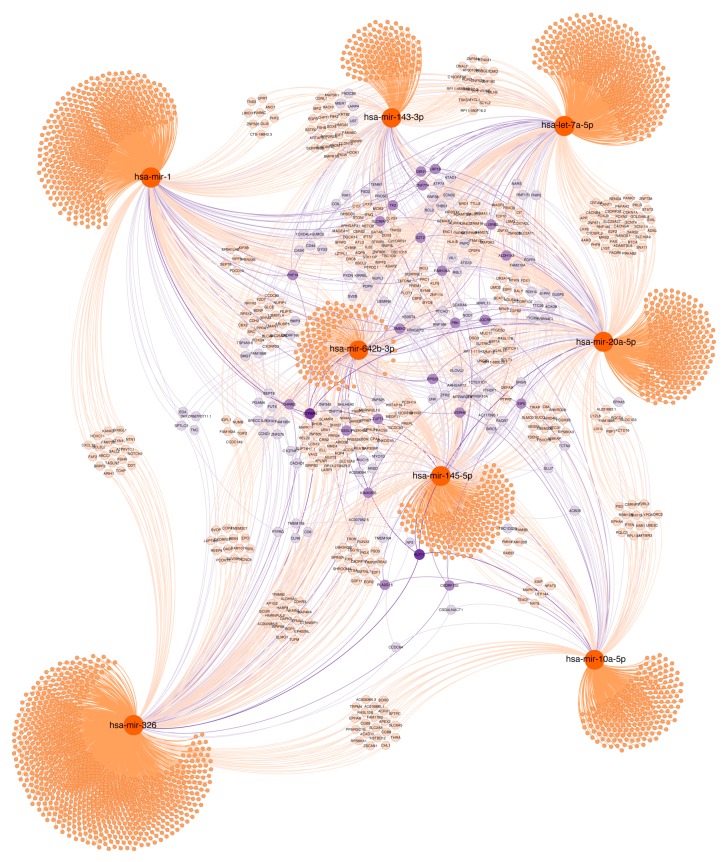
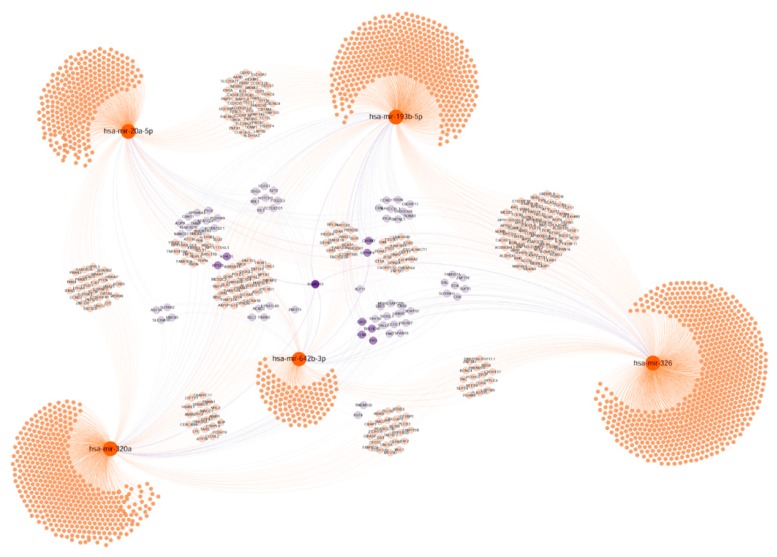
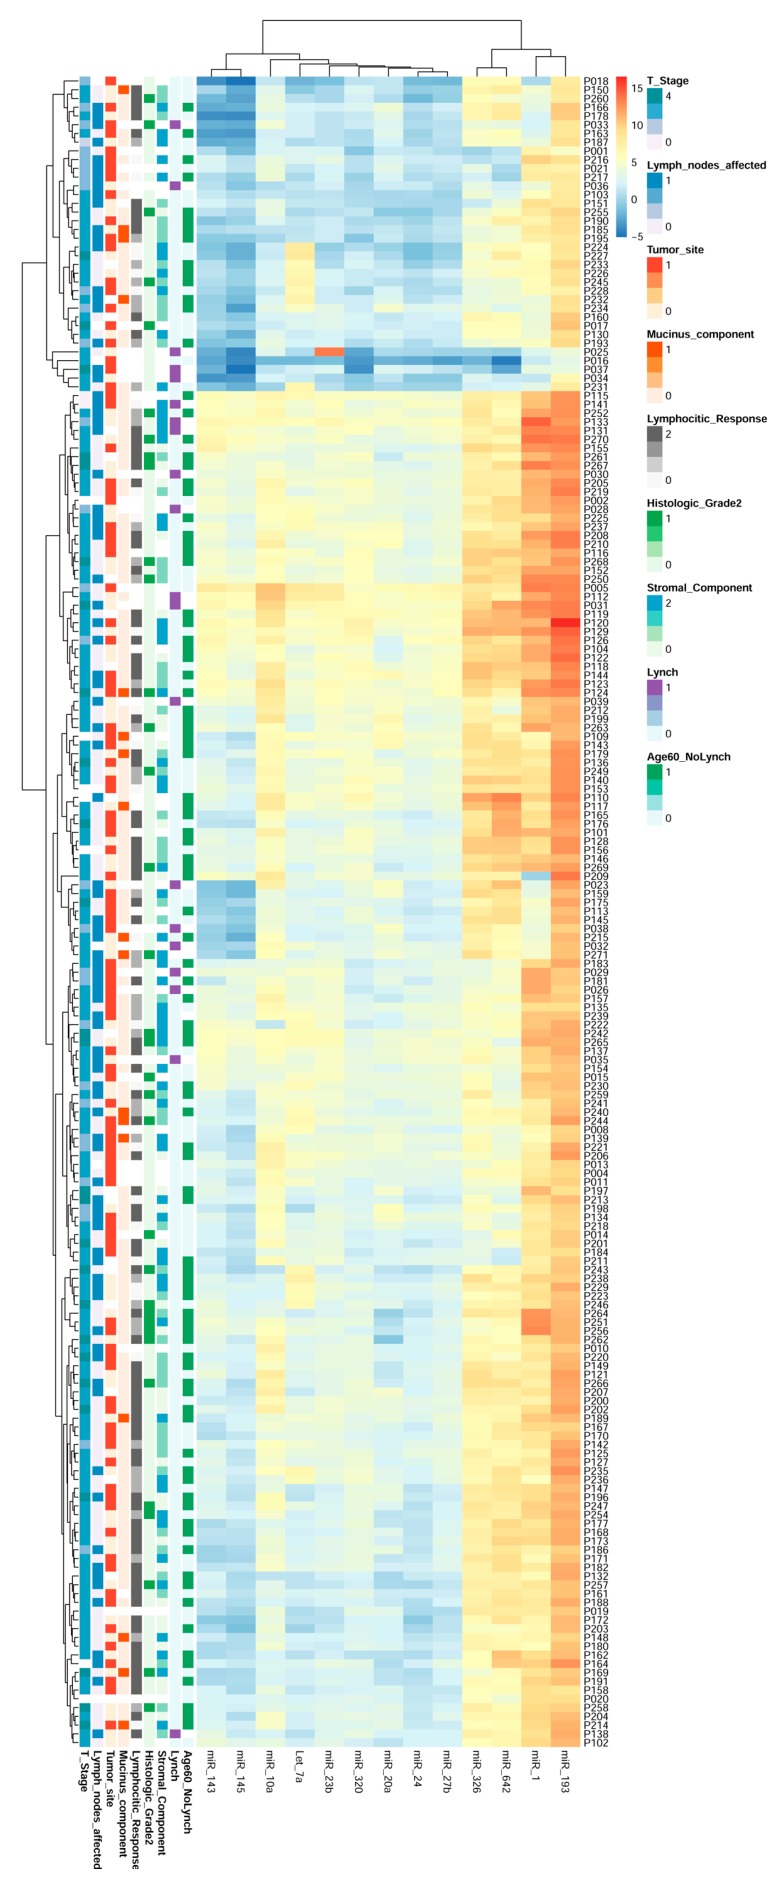
microRNAs (miRNA) expression in colorectal (CR) primary tumours can facilitate a more precise molecular characterization. We identified and validated a miRNA profile associated with clinical and histopathological features that might be useful for patient stratification. In situ hybridization array using paraffin-embedded biopsies of CR primary tumours were used to screen 1436 miRNAs. 17 miRNAs were selected for validation by quantitative reverse transcription polymerase chain reaction (qRT-PCR) (n = 192) and were further correlated with clinical and histopathological data. We demonstrated that miRNAs associated to Colorectal Cancer (CRC) diagnosis age (over 50s and 60s) included miR-1-3p, miR-23b-3p, miR-27b-3p, miR-143-3p, miR-145-5p and miR-193b-5p. miR-23b-3p and miR-24-3p discriminated between Lynch Syndrome and sporadic CRC. miR-10a-5p, miR-20a-5p, miR-642b and Let-7a-5p were associated to stroma abundance. miR-642b and Let-7a-5p were associated with to peritumoral inflammation abundance. miR-1-3p, miR-143-3p and miR-145-5p correlated with mucinous component. miR-326 correlated with tumour location (right or left sided). miR-1-3p associated with tumour grade. miR-20a-5p, miR-193b-5p, miR-320a, miR-326 and miR-642b-3p associated to tumour stage and progression. Remarkably, we also demonstrated that miR-1-3p and miR-326 expression significantly associated with patient overall survival (OS). Hierarchical clustering and bioinformatics analysis indicated that selected miRNAs could re-classify the patients and work cooperatively, modulating common target genes involved in colorectal cancer key signalling pathways. In conclusion, molecular characterization of CR primary tumours based on miRNAs could lead to more accurate patient reclassification and may be useful for efficient patient management.

Keywords: biomarkers; colorectal cancer; miRNAs; patient stratification.


Conflict of interest statement

All of the authors declared no conflict of interest.

Figures

Figure 1
Figure 1
Heat map and hierarchical clustering of microRNAs (miRNAs) in colorectal (CRC) primary tumour biopsies. 1436 miRNAs were analysed in total RNA extracted from paraffin-embedded CRC human biopsies by in situ hybridization. The clustering was performed on all samples, and on the top 50 miRNAs with the highest standard deviation. Normalized log-transformed Hy3 values were used for the analysis.
Figure 2
Figure 2
Statistical correlation, of the selected miRNAs, with age and Lynch condition. Statistical analysis using SPSS 19.0 between miRNAs levels expressed as delta crossing threshold (DCT) was performed and data regarding correlation with age (a) under 50, (b) under 60 and (c) Lynch condition are presented. Only miRNAs exhibiting a statistically significant correlation are shown. Data are presented as median and interquartile range with: * p < 0.05, ** p < 0.01, *** p < 0.001.
Figure 3
Figure 3
Statistical correlation of the selected miRNAs and biopsy histopathological features. Statistical analysis using SPSS 19.0 between miRNAs levels expressed as DCT was performed and data regarding correlation with: (a) stromal component, (b) peritumoral inflammatory infiltrate, (c) tumour grade, (d) mucinous component and (e) tumour location, are presented. Only miRNAs exhibiting statistically significant correlations are shown. Data are presented as median and interquartile range with: * p < 0.05, ** p < 0.01, *** p < 0.001.
Figure 4
Figure 4
Statistical correlation between selected miRNAs and TNM stage (tumour-node-metastasis TNM staging system), tumour invasion and progression. Statistical analysis using SPSS 19.0 between miRNA levels expressed as DCT was performed. Only miRNAs exhibiting statistically significant correlations are shown. Data are presented as median and interquartile range with p values < 0.05. (a) data regarding correlation with tumour stage (b) tumour invasiveness and (c) lymph node affection are presented. * p < 0.05, ** p < 0.01, *** p < 0.001.
Figure 4
Figure 4
Statistical correlation between selected miRNAs and TNM stage (tumour-node-metastasis TNM staging system), tumour invasion and progression. Statistical analysis using SPSS 19.0 between miRNA levels expressed as DCT was performed. Only miRNAs exhibiting statistically significant correlations are shown. Data are presented as median and interquartile range with p values < 0.05. (a) data regarding correlation with tumour stage (b) tumour invasiveness and (c) lymph node affection are presented. * p < 0.05, ** p < 0.01, *** p < 0.001.
Figure 5
Figure 5
CRC progression indicated by miRNAs expression. Overall survival (a) and progression free survival (b) correlation studies have been performed by means of Kaplan Meier curves. Median value of each miRNA has been used to distribute high and low miRNA values. High expression of miR-1-3p and miR-326 are significantly associated with longer overall survival and higher expression of miR143-3p and miR-320a correlate with longer progression free survival.
Figure 6
Figure 6
Target gene networks of validated miRNAs associated with age and Lynch syndrome. Selected miRNAs are highlighted in orange. Genes with at least two potential interactions were labelled. Genes with just one connection are unlabelled. Colour nodes of regulated genes are proportional to node degree (number of connections).
Figure 7
Figure 7
Target gene network of validated miRNAs associated with biopsy histopathological features. Selected miRNAs are highlighted in orange. Genes with at least two potential interactions were labelled. Genes with just one connection are unlabelled. Colour nodes of regulated genes are proportional to node degree (number of connections).
Figure 8
Figure 8
Target genes network of validated miRNAs associated with tumour invasion and progression. Selected miRNAs are highlighted. Genes with at least two potential interactions were labelled. Genes with just one connection are unlabelled. Colour nodes of regulated genes are proportional to node degree (number of connections).
Figure 9
Figure 9
Heat map and hierarchical cluster of the validated miRNAs reclassifying CRC patients. The 13 validated miRNAs analysed by qRT-PCR in 192 CRC human biopsies allows for a new classification of the patients into 2 groups, which is independent of clinical features and based on miRNA pattern expression.

References

    1. Arnold M., Sierra M.S., Laversanne M., Soerjomataram I., Jemal A., Bray F. Global patterns and trends in colorectal cancer incidence and mortality. Gut. 2017;66:683–691. doi: 10.1136/gutjnl-2015-310912. - DOI - PubMed
    1. Worthley D.L., Leggett B.A. Colorectal cancer: Molecular features and clinical opportunities. Clin. Biochem. Rev. 2010;31:31–38. - PMC - PubMed
    1. Arvelo F., Sojo F., Cotte C. Biology of colorectal cancer. Ecancermedicalscience. 2015;9:520. doi: 10.3332/ecancer.2015.520. - DOI - PMC - PubMed
    1. Perez-Villamil B., Romera-Lopez A., Hernandez-Prieto S., Lopez-Campos G., Calles A., Lopez-Asenjo J.A., Sanz-Ortega J., Fernandez-Perez C., Sastre J., Alfonso R., et al. Colon cancer molecular subtypes identified by expression profiling and associated to stroma, mucinous type and different clinical behavior. BMC Cancer. 2012;12:260. doi: 10.1186/1471-2407-12-260. - DOI - PMC - PubMed
    1. Turner N., Wong H.L., Templeton A., Tripathy S., Whiti Rogers T., Croxford M., Jones I., Sinnathamby M., Desai J., Tie J., et al. Analysis of local chronic inflammatory cell infiltrate combined with systemic inflammation improves prognostication in stage II colon cancer independent of standard clinicopathologic criteria. Int. J. Cancer. 2016;138:671–678. doi: 10.1002/ijc.29805. - DOI - PubMed