. 2019 Mar 29;16(152):20180766.
doi: 10.1098/rsif.2018.0766.

Exploiting network topology for large-scale inference of nonlinear reaction models

Affiliations

Exploiting network topology for large-scale inference of nonlinear reaction models

Nikhil Galagali et al. J R Soc Interface. .

Abstract

The development of chemical reaction models aids understanding and prediction in areas ranging from biology to electrochemistry and combustion. A systematic approach to building reaction network models uses observational data not only to estimate unknown parameters but also to learn model structure. Bayesian inference provides a natural approach to this data-driven construction of models. Yet traditional Bayesian model inference methodologies that numerically evaluate the evidence for each model are often infeasible for nonlinear reaction network inference, as the number of plausible models can be combinatorially large. Alternative approaches based on model-space sampling can enable large-scale network inference, but their realization presents many challenges. In this paper, we present new computational methods that make large-scale nonlinear network inference tractable. First, we exploit the topology of networks describing potential interactions among chemical species to design improved 'between-model' proposals for reversible-jump Markov chain Monte Carlo. Second, we introduce a sensitivity-based determination of move types which, when combined with network-aware proposals, yields significant additional gains in sampling performance. These algorithms are demonstrated on inference problems drawn from systems biology, with nonlinear differential equation models of species interactions.

Keywords: Bayesian inference; model selection; network inference; reaction network; reversible-jump MCMC.


Conflict of interest statement

We have no competing interests.

Figures
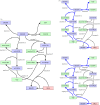
Figure 1.
Figure 1.
Chemical reaction networks. (a) A reaction network. (b) Two networks with identical effective network (in blue). (Online version in colour.)
Figure 2.
Figure 2.
Taxonomy of reaction network elements: chemical species in column (a–c), reactions in column (d–f). (Online version in colour.)
Figure 3.
Figure 3.
Efficient RJMCMC is achieved by ‘aligning’ densities on (k1,1, u) and (k2,1, k2,2) via the choice of the map f and the proposal q(u|k1,1). (Online version in colour.)
Figure 4.
Figure 4.
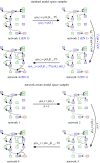
Moving from Network 1 to Network 2 or from Network 2 to Network 3 with network-unaware (NuA) and network-aware (NA) approaches leads to the proposal adapting to the prior. For the move between Networks 3 and 4, our NA approach employs a proposal that approximates the joint conditional posterior p(k1,k2,k3|k1:3,D). By contrast, the NuA approach retains the samples from the first two steps and constructs a proposal for the last move according to a proposal that only approximates the conditional posterior p(k3|k3,D). (a) Standard model space sampler. (b) Network-aware model space sampler. (Online version in colour.)
Figure 5.
Figure 5.
Sensitivity-based move determination (b) leads to the posterior densities of Model 1 (p(k1,1|M1,D)) and Model 2 (p(k2,1,k2,2|M2,D)) being aligned with proposal densities q(u1,1|k2,1, k2,2) and q(u2,1, u2,2|k1,1) respectively; produces higher MCMC acceptance rates. Without sensitivity-based proposals (a), densities are unaligned. (Online version in colour.)
Figure 6.
Figure 6.
MCMC trace plots for Example 1. (a) Standard network-unaware and (b) network-aware. (Online version in colour.)
Figure 7.
Figure 7.
Variance comparison for the eight highest-probability models in Example 1: network-unaware without derandomization, network-unaware (d) with derandomization, and network-aware with derandomization. (Online version in colour.)
Figure 8.
Figure 8.
MCMC trace plots for Example 2. (a) Standard network-unaware. (b) Network-aware. (c) Sensitivity-based network-unaware. (d) Sensitivity-based network-aware. (Online version in colour.)
Figure 9.
Figure 9.
Example 2: posterior probabilities of all models with non-zero probability, the network diagram of the data-generating model, and the one- and two-dimensional marginal densities of the parameters of the data-generating model. (Online version in colour.)

References

    1. Gelman A, Carlin JB, Stern HS, Rudin DB. 2004. Bayesian data analysis, 2nd edn Boca Raton, FL: Chapman and Hall/CRC.
    1. Friedman N, Linial M, Nachman I, Pe’er D. 2000. Using Bayesian networks to analyze expression data. J. Comput. Biol. 7, 601–620. (10.1089/106652700750050961) - DOI - PubMed
    1. Sachs K, Gifford D, Jaakkola T, Sorger P, Lauffenburger DA. 2002. Bayesian network approach to cell signaling pathway modeling. Sci. STKE 148, pe38. - PubMed
    1. Ellis B, Wong WH. 2008. Learning causal Bayesian network structures from experimental data. J. Am. Stat. Assoc. 103, 778–789. (10.1198/016214508000000193) - DOI
    1. Braman K, Oliver TA, Raman V. 2013. Bayesian analysis of syngas chemistry models. Combust. Theor. Model. 17, 858–887. (10.1080/13647830.2013.811541) - DOI

Publication types

LinkOut - more resources