. 2019 Jul:165:79-90.
doi: 10.1016/j.bcp.2019.03.014. Epub 2019 Mar 9.

Erythromycin acts through the ghrelin receptor to attenuate inflammatory responses in chondrocytes and maintain joint integrity

Affiliations

Erythromycin acts through the ghrelin receptor to attenuate inflammatory responses in chondrocytes and maintain joint integrity

Tomoya Uchimura et al. Biochem Pharmacol. 2019 Jul.

Abstract

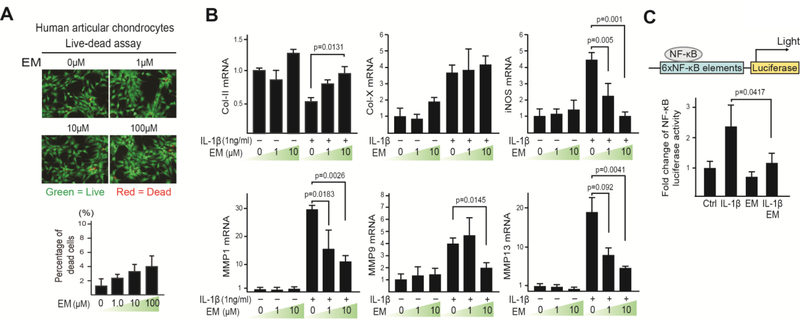
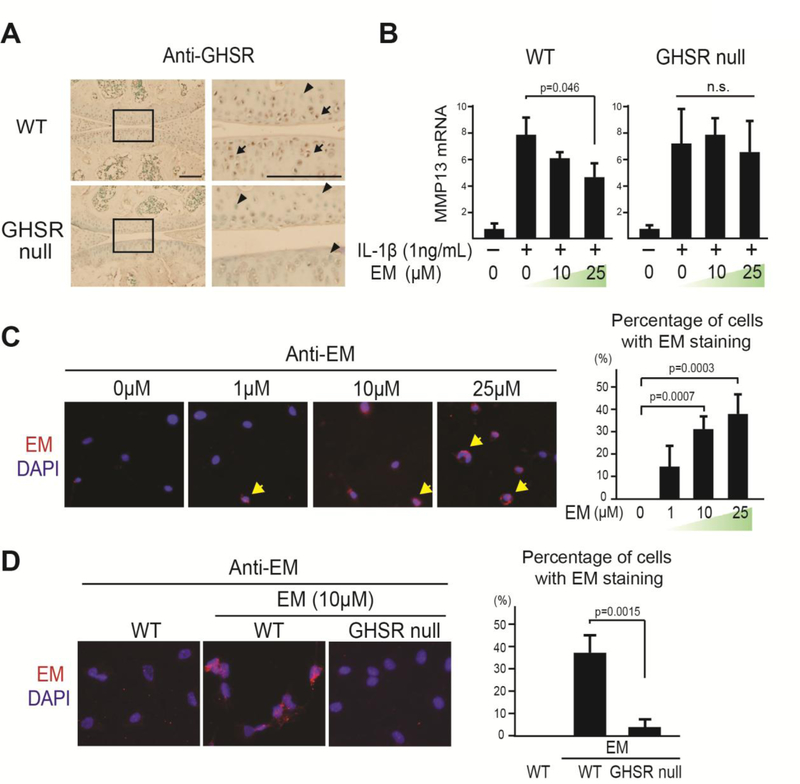
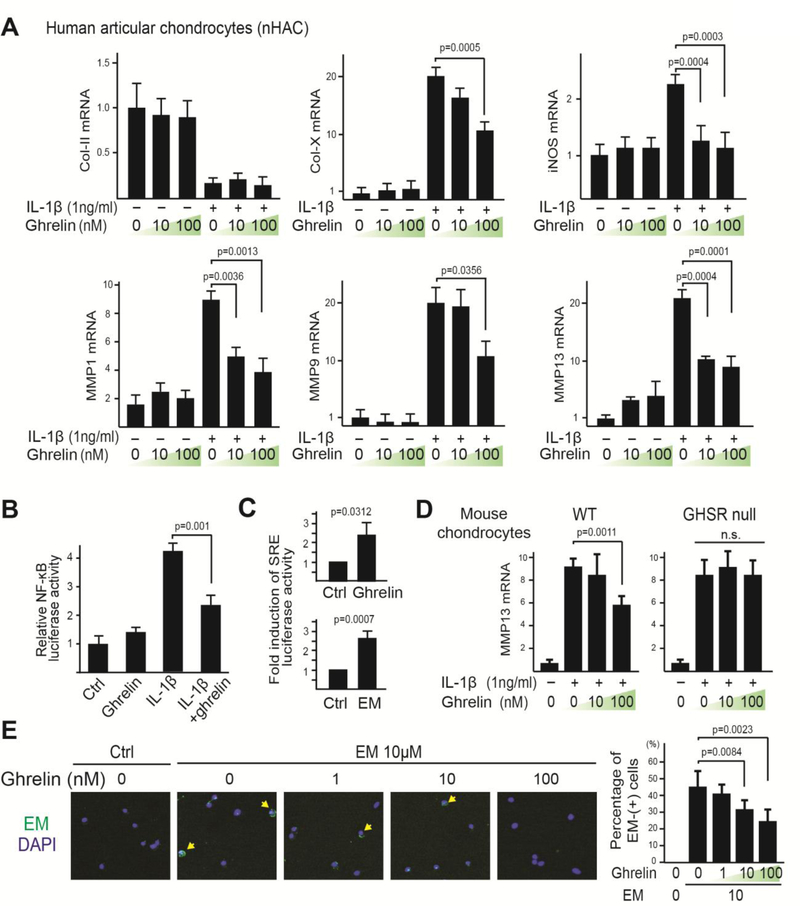
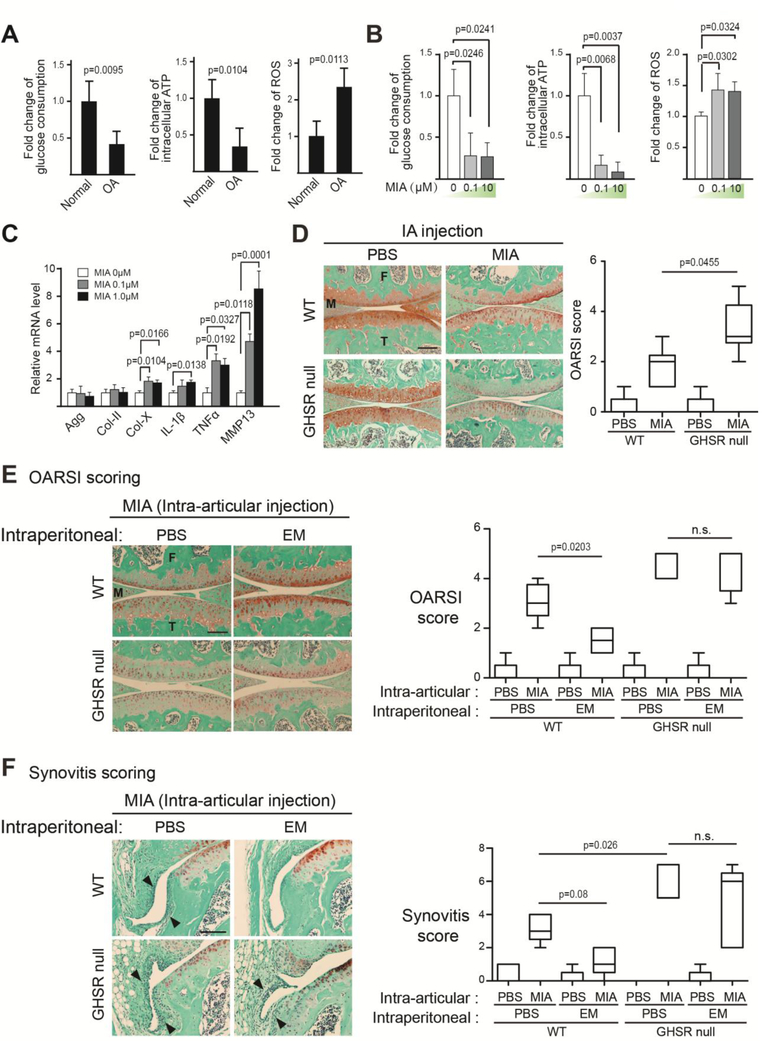
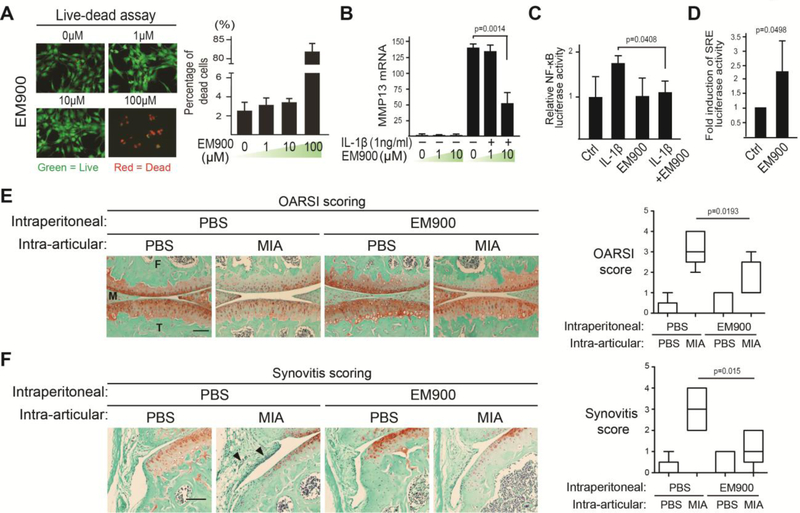
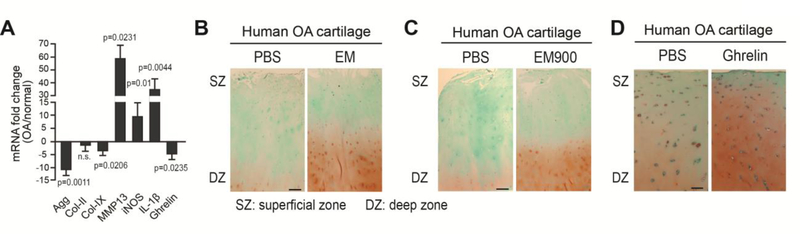
Osteoarthritis (OA) is a prevalent disease characterized by chronic joint degeneration and low-grade localized inflammation. There is no available treatment to delay OA progression. We report that in human primary articular chondrocytes, erythromycin, a well-known macrolide antibiotic, had the ability to inhibit pro-inflammatory cytokine Interleukin 1β (IL-1β)-induced catabolic gene expression and nuclear factor kappa-light-chain-enhancer of activated B cells (NF-κB) activation. Furthermore, erythromycin inhibited monosodium iodoacetate (MIA)-induced joint inflammation and cartilage matrix destruction in mice, an arthritis model that reflects the inflammatory and cartilage matrix loss aspects of OA. EM900, an erythromycin-derivative lacking antibiotic function, had the same activity as erythromycin in vitro and in vivo, indicating distinct anti-inflammatory and antibiotic properties. Using an antibody against erythromycin, we found erythromycin was present on chondrocytes in a dose-dependent manner. The association of erythromycin with chondrocytes was diminished in ghrelin receptor null chondrocytes, and administration of the ghrelin ligand prevented the association of erythromycin with chondrocytes. Importantly, the anti-inflammatory activity of erythromycin was diminished in ghrelin receptor null chondrocytes. Moreover, erythromycin could not exert its chondroprotective effect in ghrelin receptor null mice, and the loss of ghrelin receptor further augmented joint damage upon MIA-injection. Therefore, our study identified a novel pharmacological mechanism for how erythromycin exerts its chondroprotective effect. This mechanism entails ghrelin receptor signaling, which is necessary for alleviating inflammation and joint destruction.

Keywords: Cartilage; Chondrocyte; Erythromycin; Ghrelin receptor; Osteoarthritis; Synovitis.


Conflict of interest statement

Conflict of interest

None of the authors have any conflict of interest related to this work.

Figures

Fig. 1.
Fig. 1.. Erythromycin (EM) inhibits the catabolic activity of IL-1β on primary human articular chondrocytes (nHACs).
(A) Live-dead assay on chondrocytes treated with EM (1, 10 and 100μM) for 4 days. Percentage of dead cells/total cells was quantified. (B) RT-qPCR analysis of Col-II, Col-X, iNOS, MMP1, MMP9 and MMP13 on nHACs treated with EM (0, 1, and 10μM) and IL-1β (1ng/mL). TBP served as a reference gene for normalization. (C) NF-κB transactivation assay. nHACs were transiently transfected with an NF-κB reporter and treated with EM (10μM) and IL-1β (1ng/ml). A Renilla luciferase construct was co-transfected as an internal control for normalization. Data were reported as mean ± SD and analyzed by Dunnett’s test (B) and an unpaired t-test (C). At least three independent experiments were performed. * p<0.05.
Fig. 2.
Fig. 2.. The anti-inflammatory activity of EM in chondrocytes is mediated by the ghrelin receptor GHSR.
(A) Immunohistochemical (IHC) analysis using an anti-GHSR antibody (anti-GHS-R1a) on WT and GHSR null mouse knee joints. Rectangles denote areas magnified. Arrows and arrowhead indicate GHSR positive and negative cells, respectively. Scale bar = 200μm. (B) Relative MMP13 mRNA analysis on WT and GHSR null chondrocytes treated with EM (0, 10, and 25μM) and IL-1β (1ng/ml). TBP served as a loading control. (C) Immunocytochemistry (ICC) analysis with anti-EM antibody (red) on WT chondrocytes treated with different doses of EM (0, 1, 10, and 25μM) for 1hr. Arrows indicate cells with EM staining. Percentage of EM-positive cells was calculated. (D) ICC analysis with EM presence on WT and GHSR null chondrocytes treated with EM (10μM) for 1hr. Percentage of EM-positive cells was calculated. Data were reported as mean ± SD and analyzed by Dunnett’s test (B and C) and an unpaired t-test (D). At least three independent experiments were performed. * p<0.05. n.s: not significant.
Fig. 3.
Fig. 3.. Ghrelin signaling is necessary and sufficient to inhibit IL-1β-induced catabolic gene expression and NF-κB activation in chondrocytes.
(A) RT-qPCR analysis of Col-II, Col-X, iNOS, MMP1, MMP9 and MMP13 on nHACs treated with ghrelin (0, 10 and 100nM) and IL-1β (1ng/mL). TBP served as a reference gene. (B) NF-κB transactivation assay. nHACs were transiently transfected with NF-κB reporter construct for 24 hours and then treated with ghrelin (10nM) and IL-1β (1ng/mL). A Renilla luciferase construct was co-transfected as an internal control for normalization. (C) Serum Response Element (SRE) luciferase reporter assay. nHACs were transiently transfected with the SRE reporter construct for 24 hours and then treated with ghrelin (10nM) or EM (10μM) for 16 hours. A Renilla luciferase construct was co-transfected as an internal control for normalization. Data are presented as fold activation relative to untreated samples. (D) RT-qPCR analysis of MMP13 on WT and GHSR null mouse chondrocytes treated with ghrelin (0, 10, 100nM) and IL-1β (1ng/mL). TBP served as a reference gene. (E) ICC analysis with an anti-EM antibody on WT chondrocytes co-treated with EM (10μM) and different concentrations of ghrelin (1, 10 and 100nM). Arrows indicate cells with EM staining. Percentage of EM-positive cells was calculated. Data were reported as mean ± SD and analyzed by Dunnett’s test (A, D and E) and an unpaired t-test (B and C). At least three independent experiments were performed. * p<0.05. n.s: not significant.
Fig. 4.
Fig. 4.. The Ghrelin receptor is required for EM to inhibit cartilage matrix loss and synovitis in vivo.
(A) Analysis of total glucose consumption, intracellular ATP levels and reactive oxygen species (ROS) levels at day 2 of culture in healthy and OA human articular chondrocytes. (B) Analysis of total glucose consumption, intracellular ATP levels and reactive oxygen species (ROS) levels at day 2 of culture in nHACs after MIA treatment. (C) RT-qPCR analysis of aggrecan (agg), Col-II, Col-X, IL-1β, TNF⍺ and MMP13 on nHACs treated with MIA (0, 0.1 and 1μM) for 2 days. TBP served as a reference gene for normalization. (D) Safranin O staining analysis of WT and GHSR null mouse knee joints. MIA (50μg/joint) was intra-articularly injected to knee joints at day 0, and samples were harvested at day 7. The degree of cartilage matrix loss was examined according to the OARSI scoring system. (E) Safranin O staining analysis of WT and GHSR null mouse knee joints injected with MIA. MIA was intra-articularly injected to knee joints at day 0. EM (PBS as control) was IP-injected at 50μg/g into the mice daily until sample harvest at day 7. The degree of cartilage matrix loss was examined according to the OARSI scoring system. (F) Synovitis analysis on sections from the medial tibial plateau of WT and GHSR null mice knees injected with EM. MIA was intra-articularly injected to knee joints at day 0. EM (PBS as control) was IP-injected into the mice daily until sample harvest at day 7. Arrowheads indicate thickening of the synovial layers and increased cellularity of resident cells. M = Meniscus. T = Tibia. F=Femur. Synovitis was scored according to established synovitis scoring protocols. Scale bar = 200μm. For A, data were reported as mean ± SD and analyzed by an unpaired t-test. For B and C, data were reported as mean ± SD and analyzed by Dunnett’s test. Comparisons were made between MIA treatments over untreated controls for each gene. For D-F, data were reported as a box plot, where the median, as well as the maximum and the minimum data points were indicated. Data from D-F were analyzed by Kruskal-Wallis statistical test followed by Mann-Whitney U test. * p<0.05. n.s: not significant.
Fig. 5.
Fig. 5.. EM900, a non-antibiotic EM derivative, inhibits IL-1β-induced MMP13 expression and NF-κB activation, and maintains joint health in MIA-injected knees.
(A) Live-dead assay on chondrocytes treated with EM900 (0, 1, 10 and 100μM) for 4 days. Percentage of dead cells/total cells was quantified. (B) RT-qPCR analysis of MMP13 mRNA on nHACs treated with EM900 (1, 10 and 25μM) overnight followed by IL-1β (1ng/mL) treatment for 3 days. TBP served as a reference gene. (C) NF-κB transactivation assay. nHACs were transiently transfected with the NF-κB reporter construct for 24 hours and then treated with EM900 (1μM) and IL-1β (1ng/mL). A Renilla luciferase construct was co-transfected as an internal control for normalization. (D) Serum Response Element (SRE) luciferase reporter assay as a readout of ghrelin receptor signaling. nHACs were transiently transfected with the SRE reporter construct for 24 hours and then treated with EM900 (10μM) and IL-1β (1ng/mL). A Renilla luciferase construct was co-transfected as an internal control for normalization. Data were presented as “fold activation” compared to untreated samples. (E) Safranin O staining images for cartilage matrix analysis of WT mouse knee joints. MIA was intra-articularly injected to knee joints at day 0. EM900 was IP-delivered daily from the day of MIA injection. Samples were collected for analysis 7 days later. The degree of cartilage matrix loss was scored according to the OARSI scoring system. Scale bar = 200μm. M = Meniscus. T = Tibia. F = Femur. (F) Synovitis analysis on sections from the medial tibial plateau of the WT mice knees injected with EM900. MIA was intra-articularly injected into knee joints at day 0. EM900 (PBS as control) was IP-injected into the mice daily until sample harvest at day 7. Arrowheads indicate thickening of the synovial layers and increased cellularity of resident cells. Synovitis was scored according to established synovitis scoring protocols. For A to D, data were reported as mean ± SD and analyzed by Dunnett’s test (B) and an unpaired t-test (C, D). For E and F, data were reported in a box plot, where the median, as well as the maximum and the minimum data points were indicated. Data from E and F were analyzed by Kruskal-Wallis statistical test followed by Mann-Whitney U test. * p<0.05.
Fig. 6.
Fig. 6.. EM and ghrelin enhance cartilage matrix levels in human OA cartilage.
(A) RT-qPCR analysis of Agg, Col-II, Col-IX, MMP13, iNOS, IL-1β and ghrelin in human normal cartilage from 4 healthy donors and OA cartilage from 5 OA donors. TBP served as a reference gene. (B) Safranin O staining analysis on sections of OA articular cartilage explants after 3 weeks of culturing with 10μM EM. Images of explants from donor 54/F (age/sex) are shown. (C) Safranin O staining analysis on sections of OA articular cartilage explants after 3 weeks of culturing with 10μM EM900. Images of explants from donor 54/F (age/sex) are shown. (D) Safranin O staining analysis on sections of OA articular cartilage explants after 3 weeks of culturing with 100nM ghrelin. Images of explants from donor 53/F (age/sex) are shown. For each experiment, duplicate technical repeats were analyzed. Experiments were repeated three times using samples from three different OA donors. As the extent of cartilage matrix loss and OA severity of the donor samples differed among experiments, cellularity and matrix levels varied, which is evident from the differences in control samples used for EM, EM900 and ghrelin experiments. Scale bar = 100μm. SZ = superficial zone. DZ = deep zone.

References

    1. Prevalence of doctor-diagnosed arthritis and arthritis-attributable activity limitation --- United States, 2007–2009, MMWR Morb Mortal Wkly Rep, 59 (2010) 1261–1265. - PubMed
    1. Bitton R, The economic burden of osteoarthritis, Am J Manag Care, 15 (2009) S230–235. - PubMed
    1. Hochberg MC, Osteoarthritis year 2012 in review: clinical, Osteoarthritis and cartilage / OARS, Osteoarthritis Research Society, 20 (2012) 1465–1469. - PubMed
    1. Rainbow R, Ren W, Zeng L, Inflammation and Joint Tissue Interactions in OA: Implications for Potential Therapeutic Approaches, Arthritis, 2012 (2012) 741582. - PMC - PubMed
    1. Lories RJ, Luyten FP, The bone-cartilage unit in osteoarthritis, Nature reviews. Rheumatology, 7 (2011) 43–49. - PubMed

Publication types