. 2019 May 1;79(9):2379-2391.
doi: 10.1158/0008-5472.CAN-18-3015. Epub 2019 Mar 12.

Genome-Wide RNAi Screen Identifies PMPCB as a Therapeutic Vulnerability in EpCAM+ Hepatocellular Carcinoma

Affiliations

Genome-Wide RNAi Screen Identifies PMPCB as a Therapeutic Vulnerability in EpCAM+ Hepatocellular Carcinoma

Atsushi Takai et al. Cancer Res. .

Abstract

Hepatocellular carcinoma (HCC) is a genetically heterogeneous disease for which a dominant actionable molecular driver has not been identified. Patients with the stem cell-like EpCAM+AFP+ HCC subtype have poor prognosis. Here, we performed a genome-wide RNAi screen to identify genes with a synthetic lethal interaction with EpCAM as a potential therapeutic target for the EpCAM+AFP+ HCC subtype. We identified 26 candidate genes linked to EpCAM/Wnt/β-catenin signaling and HCC cell growth. We further characterized the top candidate PMPCB, which plays a role in mitochondrial protein processing, as a bona fide target for EpCAM+ HCC. PMPCB blockage suppressed EpCAM expression and Wnt/β-catenin signaling via mitochondria-related reactive oxygen species production and FOXO activities, resulting in apoptosis and tumor suppression. These results indicate that a synthetic lethality screen is a viable strategy to identify actionable drivers of HCC and identify PMPCB as a therapeutically vulnerable gene in EpCAM+ HCC subpopulations. SIGNIFICANCE: This study identifies PMPCB as critical to mitochondrial homeostasis and a synthetic lethal candidate that selectively kills highly resistant EpCAM+ HCC tumors by inactivating the Wnt/β-catenin signaling pathway.


Conflict of interest statement

Conflict of interest statement: The authors declare no conflict of interests.

Figures

Figure 1.
Figure 1.
RNAi screen for synthetic lethal candidates. (A) Scheme of the primary RNAi screen. HUH7 cells were sorted to EpCAM positive and negative proportion 3 or 5 days after the infection with lentiviral shRNA library. The intensity of each shRNA targeting 47,000 transcripts in EpCAM positive and negative cells were measured using Affymetrix GeneChip. (B) The canonical signaling pathways activated in the 26 candidate genes promoting EpCAM expression. (C) The canonical signaling pathways activated in the 50 candidates suppressing EpCAM expression. (D) Integrative analysis of 76 candidate genes based on the ingenuity pathway. The half of the genes shown are associated with ubiquitin pathway (UBC). Several red shaded genes promoting EpCAM expression are connected to CTNNB1 pathway. On the other hand, TGFβ and NFκB pathways are related to some green shaded genes suppressing EpCAM expression. (Red circles: Up-regulation, Green circles: Down-regulation, different shades represent variable changes between EpCAM+ vs. EpCAM).
Figure 2.
Figure 2.
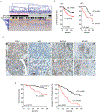
Validation of 76 candidate gene signature in HCC cohort. (A) Hierarchical clustering analysis of 247 HCC cases (LCS cohort) based on 76 candidate genes. The ‘EpCAM’ row: black (EpCAMhigh) and white bars EpCAMhigh. CDH1/VIM row: the black and white bars indicate the cases with >1 and <1 of CDH1/VIM expression ratio, respectively. (B) Kaplan-Meier plot of epithelial-like cases from the LCS (left) or LEC (right) cohort based on the dendrogram classification in the clustering analysis. P values are calculated from Cox Log Rank analysis. Only samples with clinical data are shown. (C) Immunohistochemistry of CDH1, VIM, EpCAM, and NCAM1 protein expression in the validation cohort. (a-d:100×(scale bars: 50uM) and b,d:200× (scale bars are 20μM)). (D) Kaplan-Meier curve analyses of epithelial like HCC cases. EpCAM+ cases are C1 and EpCAM cases are C2. P values are calculated from Cox Log Rank analysis.
Figure 3.
Figure 3.
The functional effect of PMPCB knockdown in HUH7 cells. (A) The relative expression level of PMPCB and EpCAM genes with two independent PMPCB shRNAs. eGFP shRNA was used as a control. (B) Flow cytometer analysis of HUH7 cells stained with anti-EpCAM antibody 5 days after the expression of each shRNA. (C) The number of colonies cultured for 10 days after two independent PMPCB shRNAs were induced. (D) The number of spheroids cultured for 14 days after two independent PMPCB shRNAs were induced. (E) The proliferation curves of cells with eGFP shRNA and PMPCB shRNA were plotted. (F) Flow cytometry analyses of CD133 and CD90 in HUH7 cells after 72 hr of PMPCB shRNA. The proportion of each marker is shown. (G) Oxygen consumption in the cells with eGFP shRNA and PMPCB shRNA under basal conditions, following the addition of oligomycin (2.5μM), FCCP or antimycin A and Rotenone. (H) Relative ATP level of the cells with PMPCB shRNA. (I) DCFDA level was measured to see the ROS activity in the cells with PMPCB shRNA compared with the control cells. All graphs are represented as mean±SD (triplicates). *p<0.05, student’s t-test between sheGFP vs. shPMPCB-1 or shPMPCB-2.
Figure 4.
Figure 4.
Apoptosis induced by PMPCB shRNA was dependent on EpCAM expression. (A) Flow cytometer analysis of EpCAM positive cells (HUH7 and HUH1) and negative cells (MHCC97) stained with anti-EpCAM antibody and 7-AAD 5 days after PMPCB shRNA transduction. (B) The proportion of 7-AAD positive cells in each cell line was shown. (C) The proportion of 7-AAD positive cells with eGFP shRNA or PMPCB shRNA treated with or without Z-VAD, caspase inhibitor in HUH7 cell line. All graphs are represented as mean±SD (triplicates). *p<0.05, student’s t-test.
Figure 5.
Figure 5.
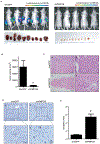
In vivo tumor suppressive effect of PMPCB shRNA. (A) Live luminescence imaging of nude mice 4 weeks after the subcutaneous inoculation of HUH7-Luc cells with eGFP shRNA or shPMPCB (upper panels: n=5, cells were injected at both side of each mouse). Macroscopic images of tumors resected immediately after the live imaging (lower panels). (B) The average volume of the tumors resected. (C) Representative microscopic (hematoxylin and eosin stain) images of tumors with eGFP shRNA and shPMPCB (a,c:40×(scale bars: 200uM) and b,d:200× (scale bars are 20μM)). (D) TUNEL staining of tumors with eGFP shRNA (a,c) and shPMPCB (b,d). (a,b:100× (scale bars are 50uM); c,d:400× (scale bars are 20μM)). (E) Apoptotic index of tumors with eGFP shRNA or PMPCB shRNA. All graphs are represented as mean±SD (triplicates). *p<0.05, student’s t-test.
Figure 6.
Figure 6.
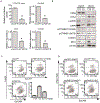
Role of PMPCB in Wnt/β-catenin pathway. (A) The relative TCF4 reporter activity on HUH7 cells (upper left). The relative mRNA expression of EpCAM (upper right), MYC (lower left) and CCDN1 (lower right) in HUH7 cells. All graphs are represented as mean±SD (triplicates). *p<0.05, student’s t-test. (B) Representative western blot analysis for the whole lysates of HUH7 and HUH1 cells. CTR: cells with eGFP shRNA, KD: cells with PMPCB shRNA. (C) Flow cytometer analysis of HUH7 cells with eGFP shRNA (upper left), PMPCB shRNA (lower left) or PMPCB shRNA with mutant CTNNB1 expression (upper right) stained with anti-EpCAM antibody and 7-AAD. The proportion of 7-AAD positive cells are shown as a bar graph (lower right). (D) Representative flow cytometer analysis of HUH7 cells with eGFP shRNA and MeBIO (upper left), eGFP shRNA and BIO (upper right), PMPCB shRNA and MeBIO (lower left) or PMPCB shRNA and BIO (lower right) stained with anti-EpCAM antibody and eFlour 520.
Figure 7.
Figure 7.
Wnt/β-catenin/FOXO pathway contributes to EpCAM+ dependency on PMPCB. (A-B) ProteinSimple analysis of FOXO1 and FOXO3A and (C) phospho_FOXO for the whole lysates, cytosol lysates and nuclear lysates of HUH7 and HepB3 cells. CTR: cells with eGFP shRNA, shPMPCB: cells with PMPCB shRNA. Represented as mean±SD of two independent Simple Western experiments. Chemiluminescence is of each protein is normalized to total protein.

References

    1. Hanahan D, Weinberg RA, Hallmarks of cancer: the next generation. Cell 144, 646–674 (2011). - PubMed
    1. Helleday T, Eshtad S, Nik-Zainal S, Mechanisms underlying mutational signatures in human cancers. Nat Rev Genet 15, 585–598 (2014). - PMC - PubMed
    1. Kaelin WG Jr., The concept of synthetic lethality in the context of anticancer therapy. Nat Rev Cancer 5, 689–698 (2005). - PubMed
    1. Shalem O, Sanjana NE, Zhang F, High-throughput functional genomics using CRISPR-Cas9. Nat Rev Genet 16, 299–311 (2015). - PMC - PubMed
    1. Wang T, Wei JJ, Sabatini DM, Lander ES, Genetic screens in human cells using the CRISPR-Cas9 system. Science 343, 80–84 (2014). - PMC - PubMed

Publication types

MeSH terms