. 2019 May;180(1):654-681.
doi: 10.1104/pp.18.01432. Epub 2019 Mar 12.

Highly Resolved Systems Biology to Dissect the Etioplast-to-Chloroplast Transition in Tobacco Leaves

Affiliations

Highly Resolved Systems Biology to Dissect the Etioplast-to-Chloroplast Transition in Tobacco Leaves

Tegan Armarego-Marriott et al. Plant Physiol. 2019 May.

Abstract

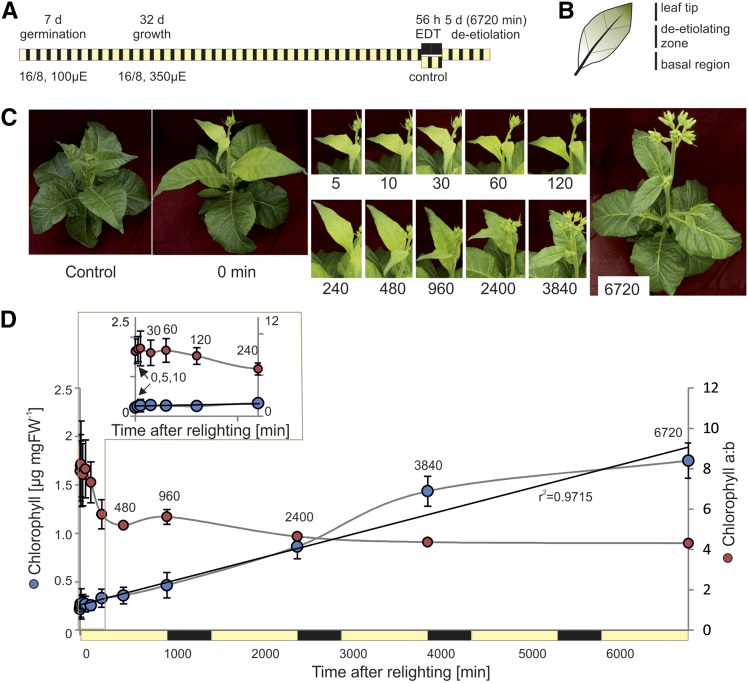
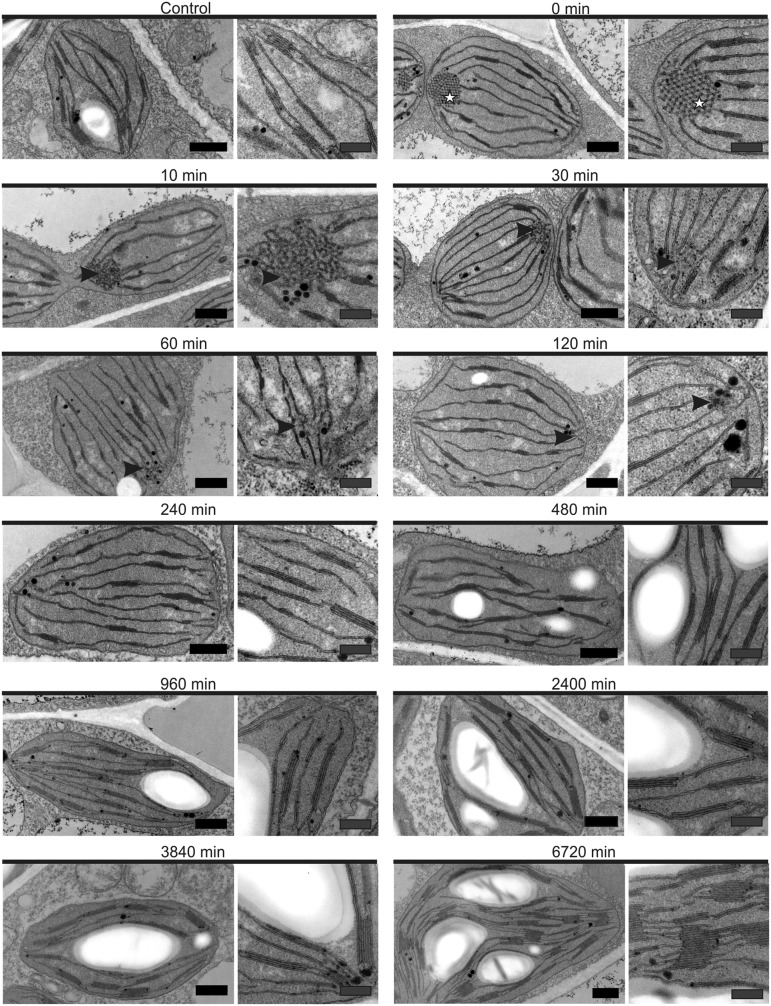
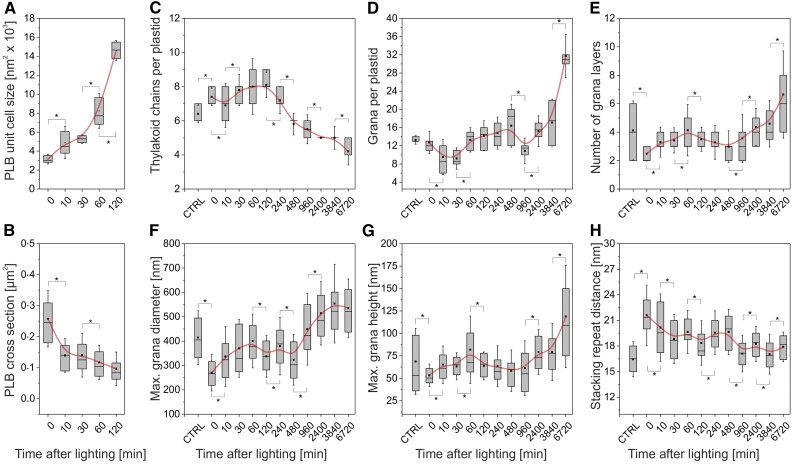
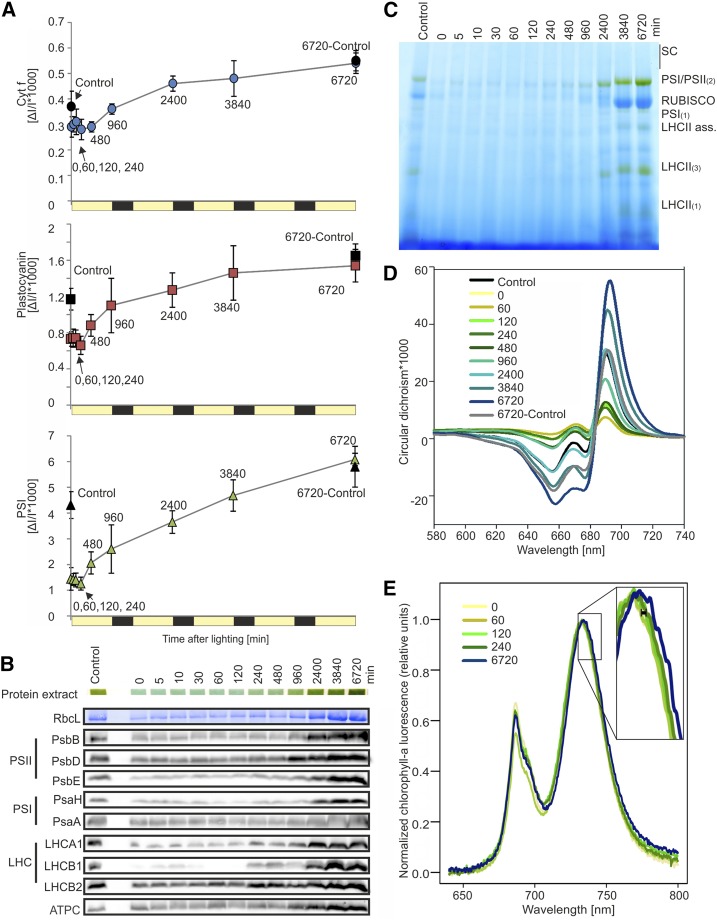
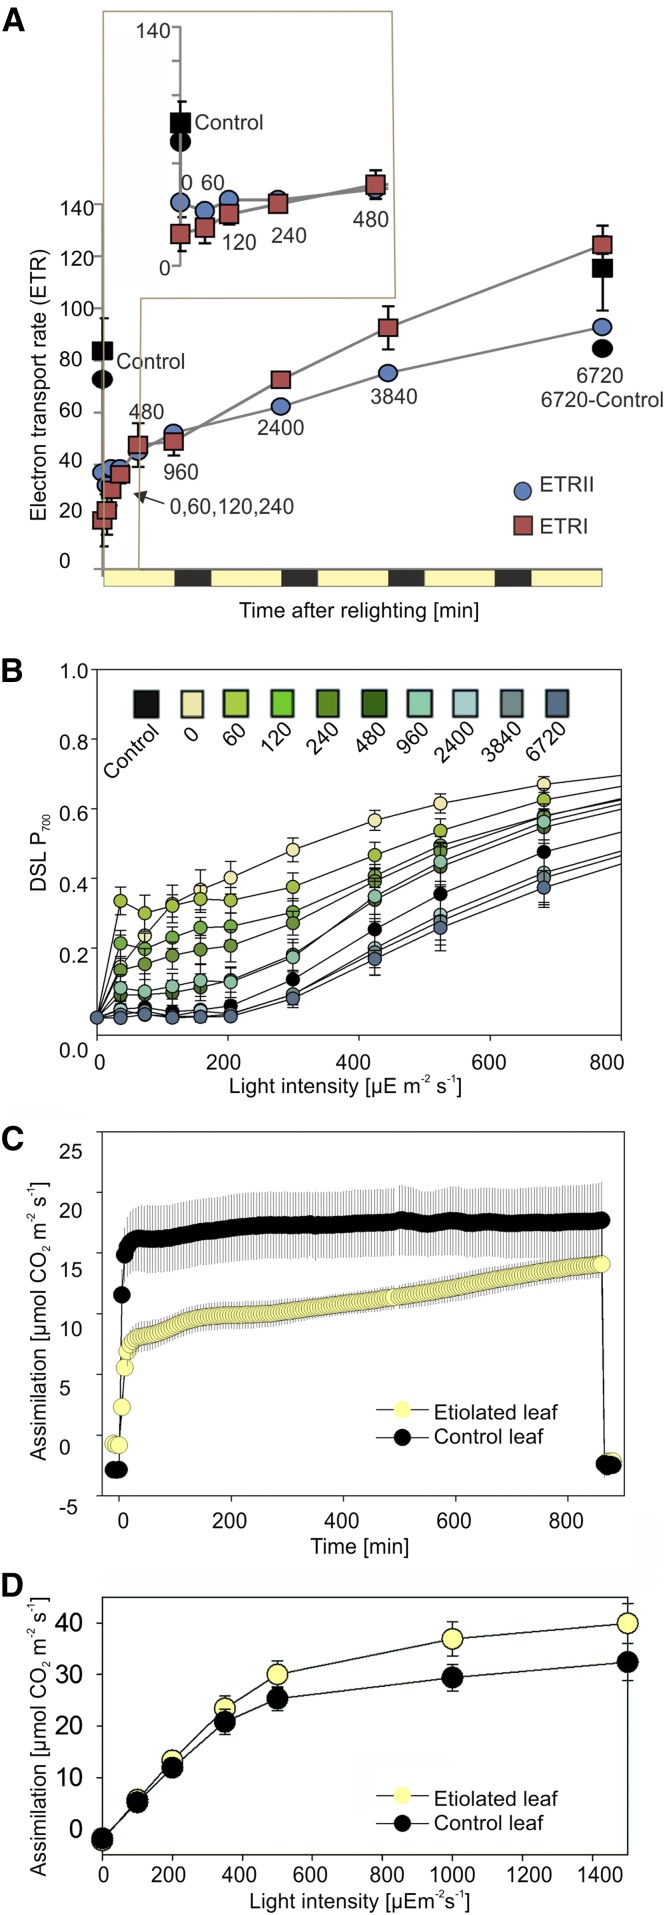
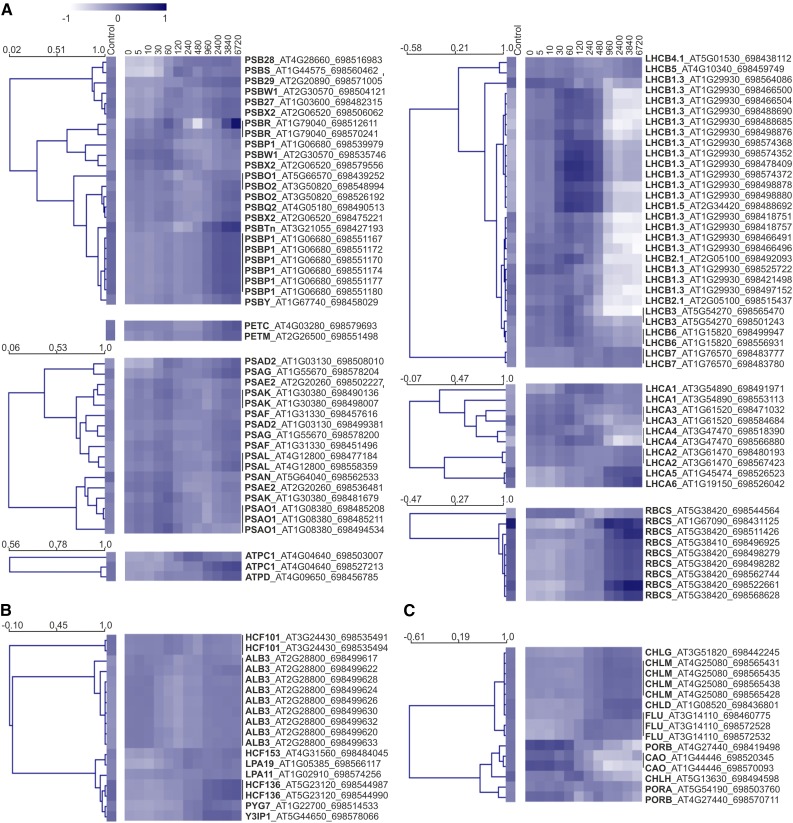
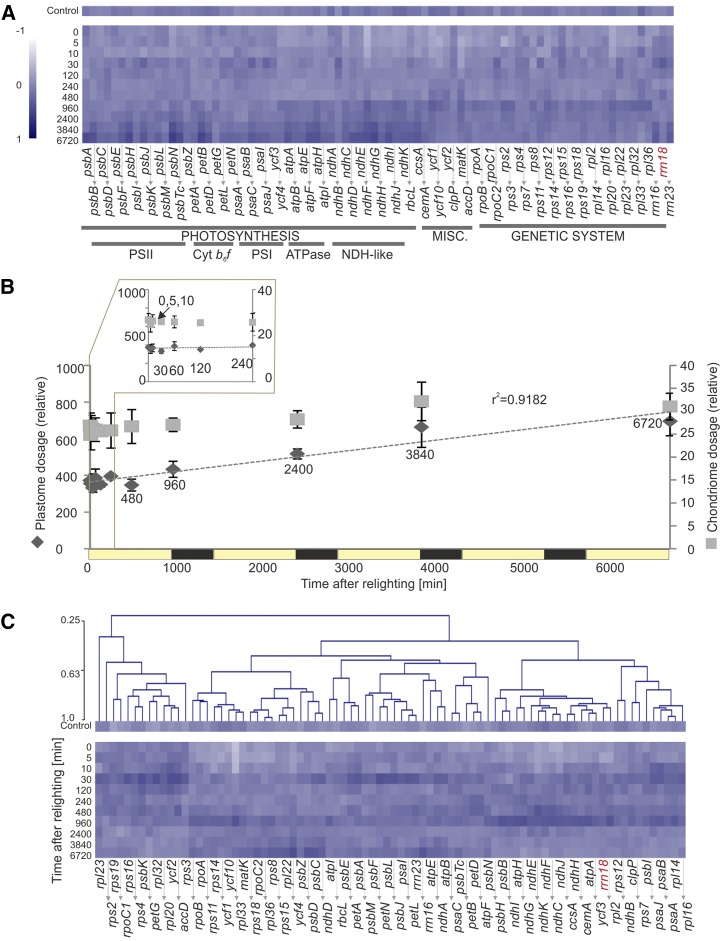
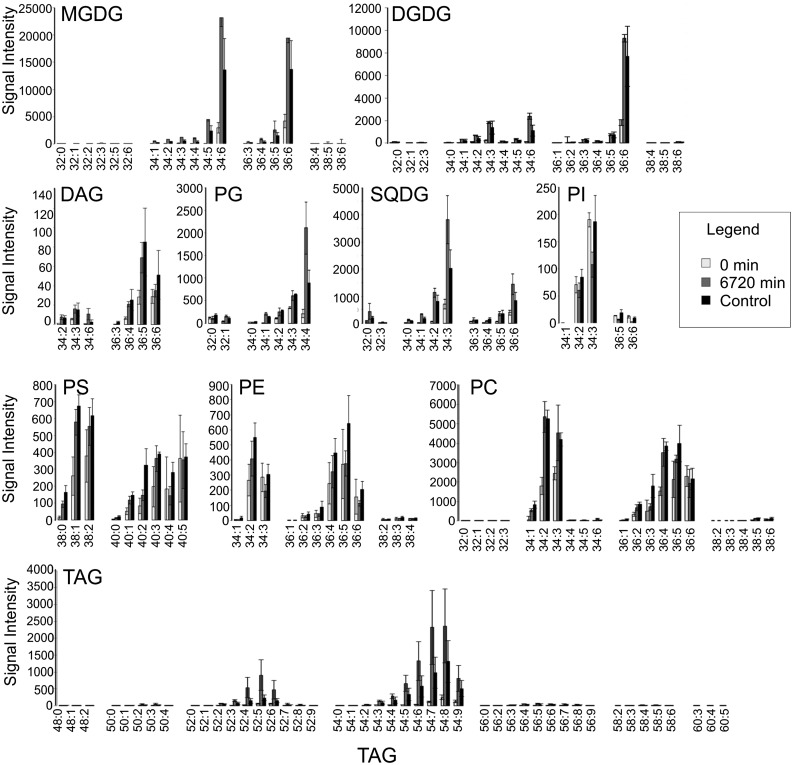
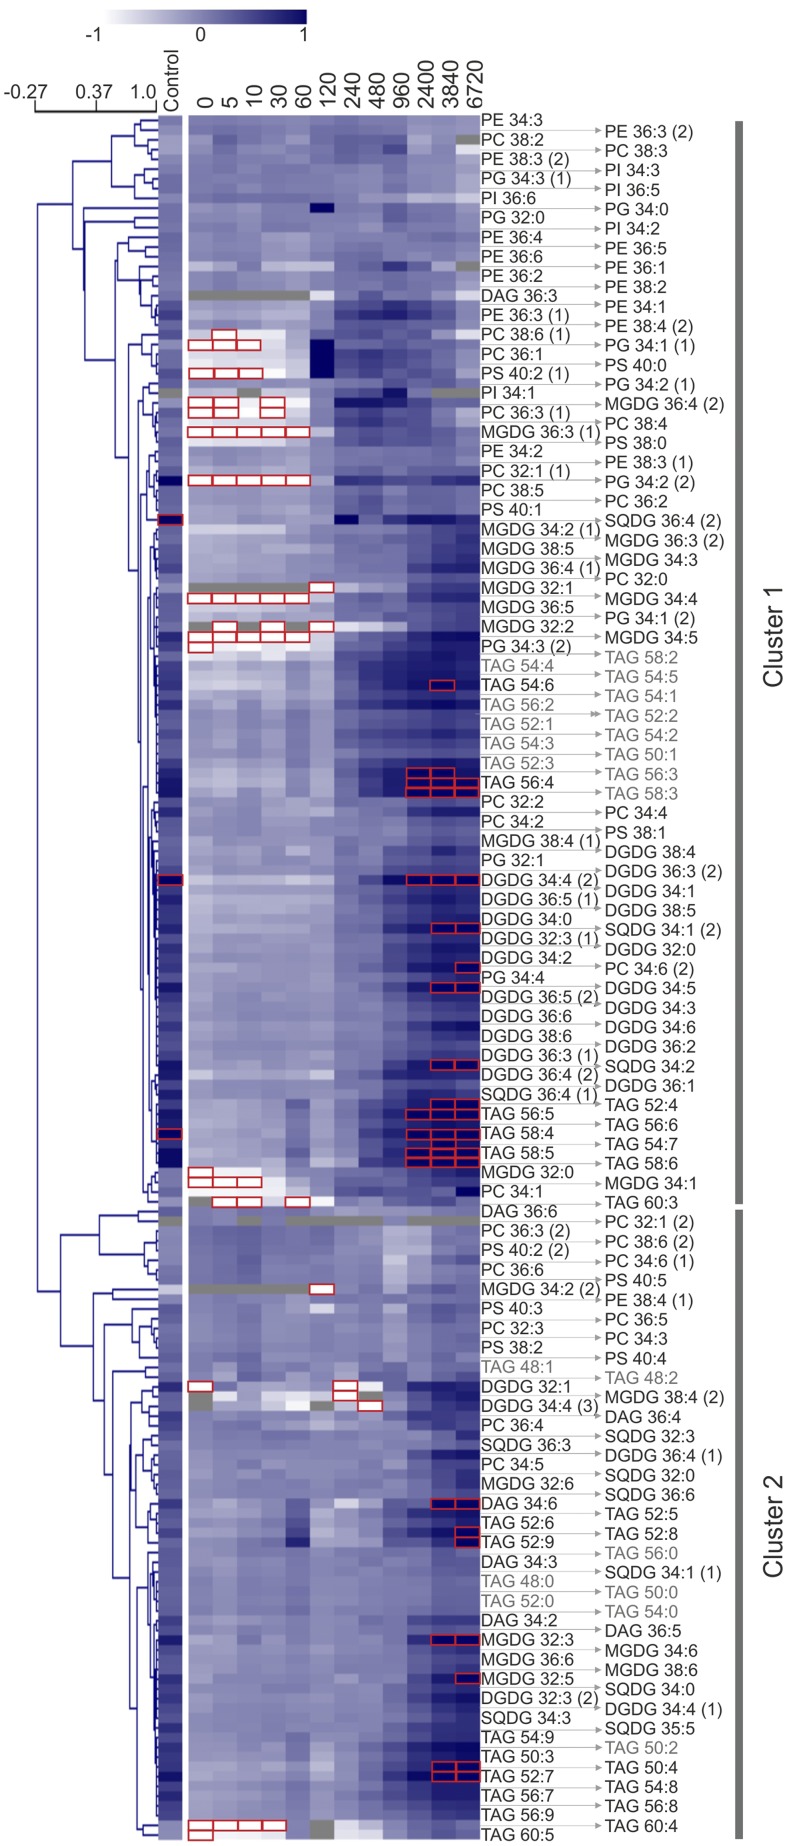
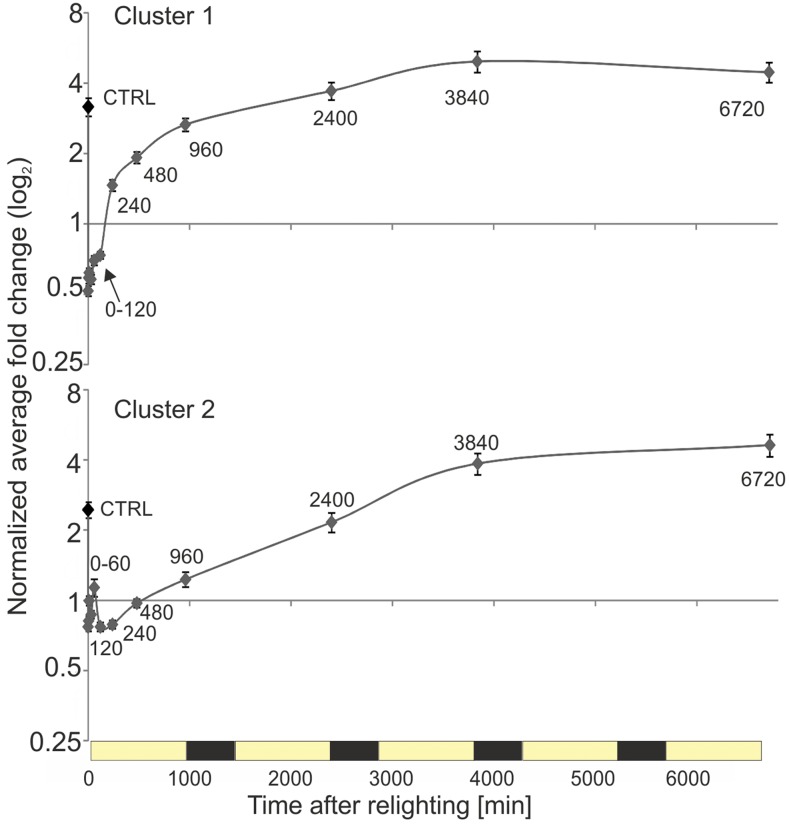
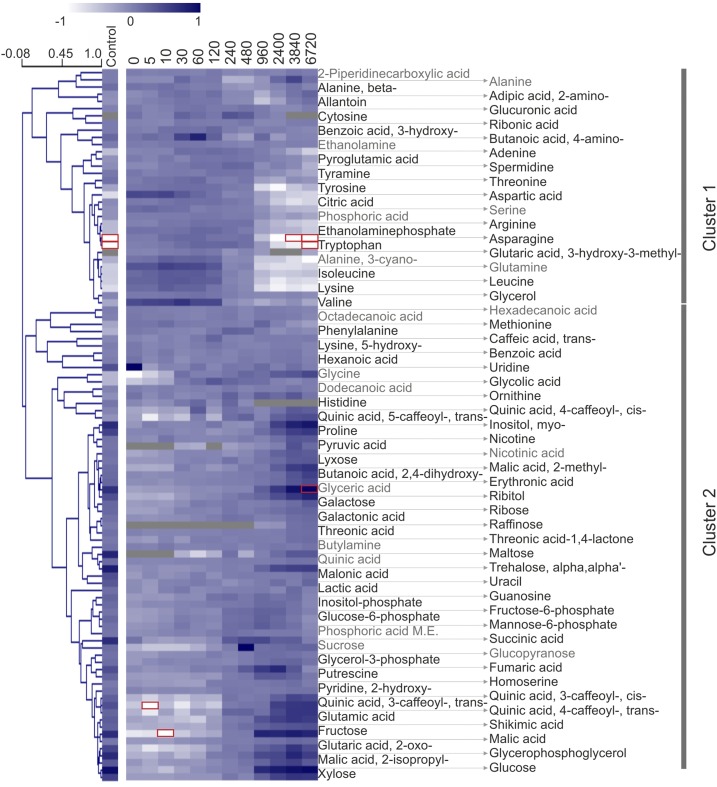
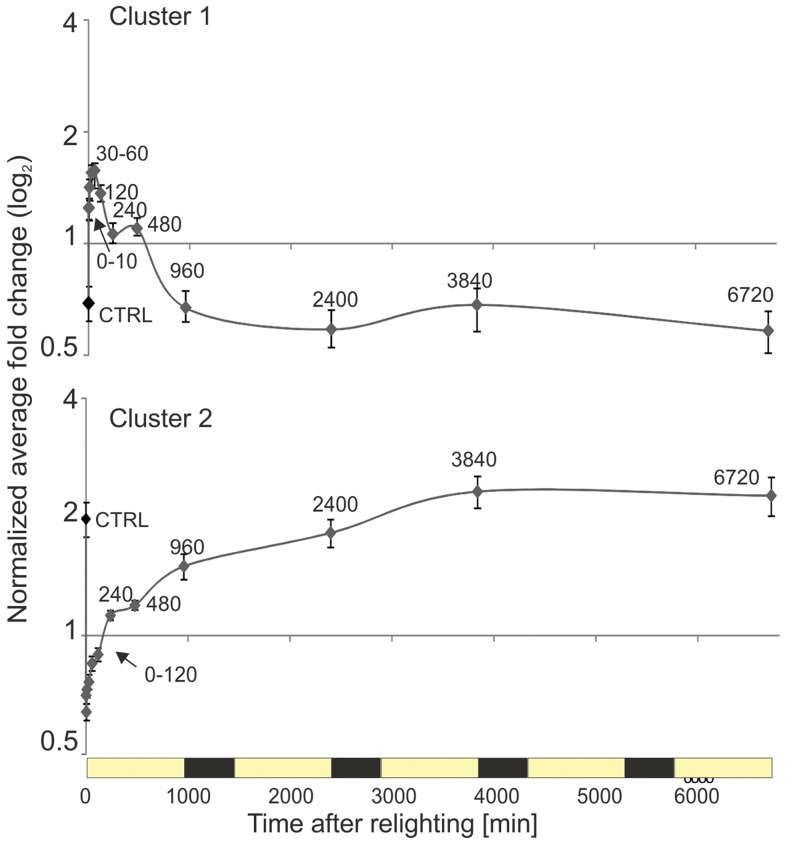
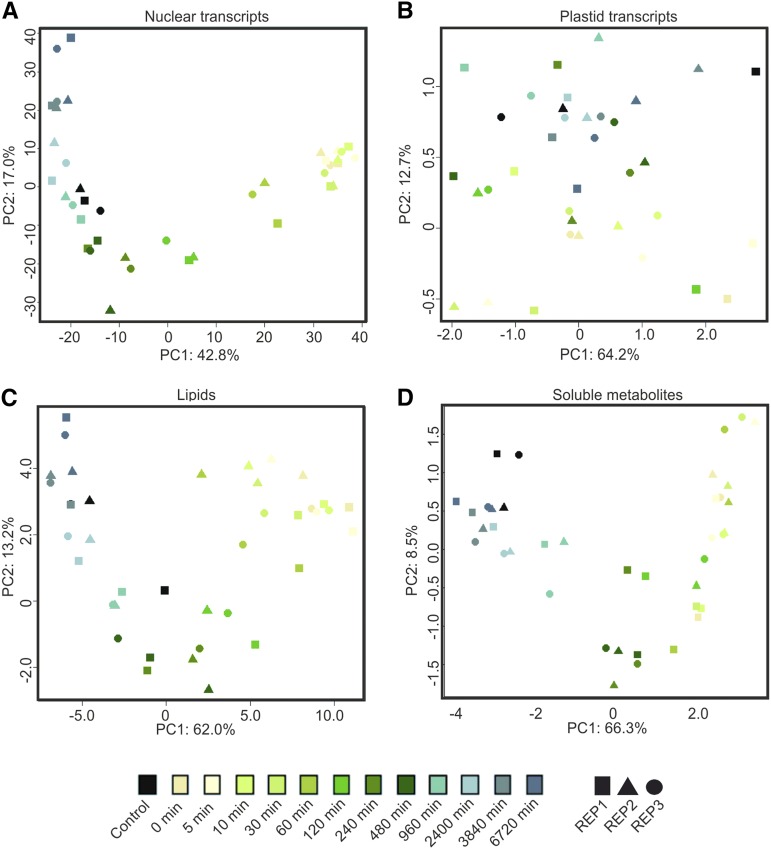
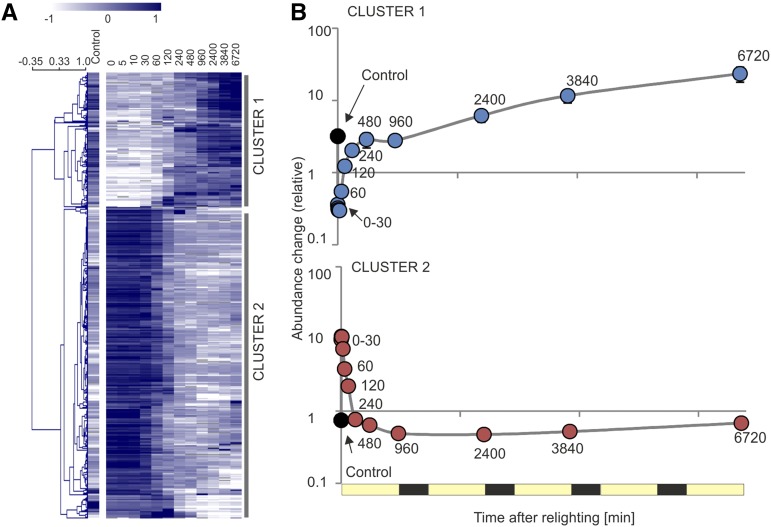
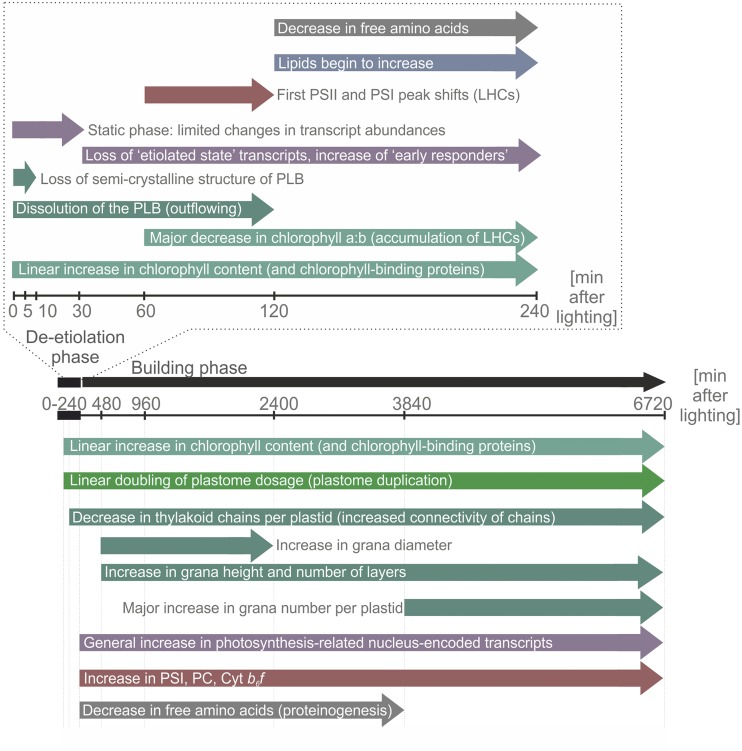
Upon exposure to light, plant cells quickly acquire photosynthetic competence by converting pale etioplasts into green chloroplasts. This developmental transition involves the de novo biogenesis of the thylakoid system and requires reprogramming of metabolism and gene expression. Etioplast-to-chloroplast differentiation involves massive changes in plastid ultrastructure, but how these changes are connected to specific changes in physiology, metabolism, and expression of the plastid and nuclear genomes is poorly understood. Here, we describe a new experimental system in the dicotyledonous model plant tobacco (Nicotiana tabacum) that allows us to study the leaf deetiolation process at the systems level. We have determined the accumulation kinetics of photosynthetic complexes, pigments, lipids, and soluble metabolites and recorded the dynamic changes in plastid ultrastructure and in the nuclear and plastid transcriptomes. Our data describe the greening process at high temporal resolution, resolve distinct genetic and metabolic phases during deetiolation, and reveal numerous candidate genes that may be involved in light-induced chloroplast development and thylakoid biogenesis.


Figures

Figure 1.
Figure 1.
A system to observe deetiolation in leaves of tobacco. A, Experimental design. Following extended dark treatment (EDT) of nearly mature tobacco plants, the dark-grown leaf sectors of young leaves were sampled across 5 d (6,720 min) of deetiolation, with particular focus on early time points. B, The measured leaf sector (deetiolating zone) was separated from the leaf tip (grown in part prior to EDT) and the basal region (newly growing tissue) following rapid freezing in liquid nitrogen. Only the deetiolating zone was used for subsequent analyses. C, Visual phenotypes of young leaves immediately following the dark treatment (0 min) and throughout the greening time course. The control plant was kept under standard growth conditions and harvested at t = 0. Numbers under the images represent time after lighting in minutes. D, Total chlorophyll content and chlorophyll a/b ratio in etiolated and deetiolating samples. Error bars indicate sd (n = 3). The black line indicates a linear trend, fitted to changing chlorophyll content, with the r2 value of the regression shown. The first 240 min are shown as an inset. Time points 960, 2,400, 3,840, and 6,720 min correspond with the end of the photoperiod on days 1, 2, 3, and 5 after lighting, respectively. FW, Fresh weight.
Figure 2.
Figure 2.
Transmission electron micrographs of plastids present in chemically fixed deetiolating tobacco leaves. Etiolated leaf tissue contained plastids with structured, paracrystalline PLBs, in contrast with control plastids, harvested at the same time but not subjected to extended dark treatment. After just 10 min, the PLBs (stars) took on a less uniform, more irregular shape (arrowheads) and simultaneously began to disintegrate: residual PLBs were absent after 120 min of light. Subsequent time points were marked by increased abundance and size of grana membranes and the gradual accumulation of starch. Images at right reveal membrane structures at higher magnification. See Figure 3 and Supplemental Table S1 for quantification. For technical reasons (sample processing time), the 5 min time point was excluded from microscopy analysis. See Supplemental Figure S1 for comparison between chemical fixation and high-pressure freezing and Supplemental Figure S2 for further images of the etiolated plastids. Black bars = 500 nm and gray bars = 250 nm.
Figure 3.
Figure 3.
Quantitative changes in key structural parameters of the plastid membrane system during greening. The x axis indicates time after lighting in minutes. Note the nonlinearity of the time scale. CTRL indicates the control sample, taken at t = 0 but not subjected to extended dark treatment. Box plots show median and interquartile range, with averages represented by the dots. Asterisks indicate significant changes (P < 0.05) between subsequent time points, as calculated by Student’s t test. A, Increasing PLB cross-sectional unit cell size during the first 120 min of deetiolation. After this time point, PLBs were not visible in greening plastids (Fig. 2). n = 20 PLBs per time point. B, Decreasing size of the PLB. Size was estimated from 50 fields of view under 8,000× magnification (∼500 organelles) for each time point. C and D, Number of thylakoid chains (C) and grana (D) per plastid. The decrease in number of thylakoid chains after 120 min likely arises due to increased connectivity between chains. n = 20 plastids at each time point. E, Number of thylakoid layers per granum. n = 30 to 50 grana for each time point. F and G, Maximum grana diameter (F) and height (G). n = 30 to 50 grana for each time point. H, Stacking repeat distance. n = 30 to 50 grana for each time point.
Figure 4.
Figure 4.
Accumulation of photosynthetic proteins and complexes. A, Accumulation of cyt b6f, PCy, and PSI as measured in vivo by difference absorbance spectroscopy. PSI is quantified from the difference transmission signal of P700, and cyt f is used as a proxy for redox-active cyt b6f. Time points 5, 10, and 30 min were excluded for technical reasons (duration of the measurements). Control plants, which did not undergo extended dark treatment, were measured at both t = 0 (Control) and at the end of the time course (6720-Control). For all three components, minimal changes were seen in the first 240 min, with a large change in rate of accumulation noted before the end of the first day (240–960 min). Subsequently, PSI abundance increased quasilinearly (r2960-6720 = 0.988), while PCy and cyt f demonstrated a generally decreasing rate of accumulation with time. B, Immunoblots with antibodies against selected proteins associated with the light reactions of photosynthesis. Samples were taken from omics tissue pools and loaded on an equal fresh weight basis. RbcL shows the selected band on a Coomassie Blue-stained membrane. Protein extract shows the solubilized protein (in loading dye) within gel wells prior to running. The complete data set, including replicates and quantification, is included as Supplemental Figure S2. C, BN-PAGE. Samples were taken from omics pools and loaded on an equal fresh weight basis. SC represents supercomplexes, and numbers in parentheses indicate monomers (1), dimers (2), or trimers (3); LHCII ass. refers to LHCII assembly complexes, which have been proposed to be a solubilization-induced dissociation product of the PSII-LHCII supercomplexes (Järvi et al., 2011). PSI/PSII dimers, Rubisco, and the LHCs increase in abundance after approximately 480 to 960 min of lighting and continue to increase throughout the time course. D, CD spectroscopy, measured by equal leaf surface area. The control plant, which did not undergo extended dark treatment, was also measured at the end of the time course (6720-Control). The amplitude of the (+)690-nm band, representative of LHCII-PSII supercomplexes, and of the (−)655-nm band, linked to accumulation of LHCII timers, first increased between 60 and 120 min after lighting and continued to increase throughout the time course. Numbers in the legend represent minutes after lighting. E, Changes in the wavelength of the PSI chlorophyll a fluorescence emission peak (∼733 nm) under 77K conditions. An initial shift, indicating attachment of the LHCs to the PS core, occurred between 60 and 120 min after lighting (black bar in enlargement), with further shifts occurring throughout the time course. The complete data set is included as Supplemental Figure S3.
Figure 5.
Figure 5.
Changing activity of the photosystems during greening. A, ETRII and ETRI. ETRs were measured on an equal leaf surface area basis and calculated using measured absorbance (averages shown in Supplemental Table S2). The inset shows early time points (0–40 min). A nondarkened control sample was measured at t = 0, in agreement with sampling for omics pools, as well as at the end of the time course, shown in black (6720-Control). Error bars, where visible, show sd for nonabsorbance-corrected measurements. n = 5. B, Light response curve for the donor side limitation (DSL) of the PSI reaction center chlorophyll P700. A DSL of 0 means that all P700 are in their reduced state, while a DSL of 1 means that P700 is fully oxidized (P700+) and photochemically inactive. C, Carbon assimilation during the first 800 min (14 h) of lighting in a leaf exposed to extended dark treatment (Etiolated leaf) and a leaf grown under standard conditions (Control leaf). Measurements were made under growth light (350 µE m−2 s−1) and saturating CO2 (2,000 µL L−1). The first and last data points show leaf respiration in darkness. D, Light response curve for carbon assimilation following 100 h of lighting (4 h into the photoperiod of the fifth day).
Figure 6.
Figure 6.
Accumulation of nucleus-encoded transcripts related to the accumulation of the photosynthetic complexes. Average normalized expression profiles of transcripts are shown for the nucleus-encoded subunits of photosynthetic protein complexes (A), selected complex biogenesis and assembly factors (B), and selected enzymes and accessory proteins of the chlorophyll biosynthesis pathway (C). Transcripts were quantified by RNAseq, with mapping to the tobacco maternal progenitor, N. sylvestris. Transcripts are identified by their common gene name, Arabidopsis Gene Initiative identifier, and N. sylvestris gene identifier, with Arabidopsis Gene Initiative identifiers assigned based on BLAST homology to N. sylvestris transcripts (for details, see “Materials and Methods”). Heat map colors indicate deviation from the log10 transcript median value (0) across the time course, shown here averaged for the three biological repeats. Hierarchical clustering (Pearson, average linkage) was undertaken in Multiple Experiment Viewer: cluster distances are indicated (scale bars show node height). Samples (except the control) are named for time after lighting in minutes.
Figure 7.
Figure 7.
Accumulation of plastid-encoded transcripts with greening. Transcript accumulation was quantified by RT-PCR with normalization to highly stable nuclear transcripts, as defined by GeNorm, with heat maps and clustering (Pearson, average linkage) created with Multiple Experiment Viewer from log10-transformed median-normalized averages of three biological repeats. Samples (except the control) are named for time after lighting in minutes. Heat map color indicates abundance relative to the median (value of 0). A, Transcript accumulation shown by functional grouping. Relative abundance of plastid transcripts changes very little during the time course (less than 2.5-fold in either direction from the median). The nucleus-encoded 18S rRNA (rrn18) is shown in red. B, Quantification of plastome and chondriome copy numbers, relative to the allotetraploid tobacco nuclear genome. While chondriome copies per genome increased just 24% during the time course, plastome copies nearly doubled (from 350 to 695 chondriome copies per genome). C, Further normalization of transcript abundances to plastome copy numbers reveals the extremely limited change in plastid transcript accumulation during greening. This suggests that, generally, the overall increase in plastid transcript abundance arises due to plastome duplication, as opposed to increased transcriptional activity. Nonetheless, a trend of transiently increased transcript abundance occurs for nearly all genes 30 min after lighting.
Figure 8.
Figure 8.
Normalized signal of the identified apparent lipid species in etiolated (0 min), green (6720 min), and control tissue. The y axis indicates signal intensity, normalized to sample fresh weight and the internal control, PC 34:0. The x axis indicates apparent species. Values are averages of three biological repeats with associated sd values. Note that MGDGs, DGDGs, SQDGs, and TAGs showed massive signal increase between etiolated and green tissue.
Figure 9.
Figure 9.
Accumulation of lipids with greening. Lipid abundances were quantified by liquid chromatography-tandem mass spectrometry with normalization to fresh weight and the internal standard (PC 34:0) and are represented as averages of three biological repeats. The average accumulation profiles of the identified clusters (1 and 2) are shown in Figure 10. Species found also in blank samples are shown in gray (see “Materials and Methods”), and values higher than 1 or lower than −1 (outside of the color range limits) are boxed in red. See Figure 6 for heat map and clustering details.
Figure 10.
Figure 10.
Average accumulation kinetics for lipids belonging to clusters 1 and 2. Normalized average fold changes for all apparent species belonging to clusters 1 and 2 are shown. Values are shown with associated se. Cluster assignment is based on hierarchical clustering (Pearson, average linkage; Fig. 9). On average, members of both clusters showed limited variation within the first 120 min of lighting. Cluster 1 species increased primarily between 120 and 240 min and then generally continued to increase, although at a progressively decreasing rate, until the end of day 3 (3,840 min). By contrast, cluster 2 species increased rapidly between 120 and 3,840 min. Both clusters contained a diverse mix of lipids representing different classes, carbon chain lengths, and degrees of saturation (compare with Fig. 9).
Figure 11.
Figure 11.
Accumulation of soluble metabolites with greening. Soluble metabolites were quantified by gas chromatography-tandem mass spectrometry (GC-MS) with normalization to fresh weight and the internal standard, [13C6]sorbitol, and are represented as a median-normalized averages of three biological repeats. Phosphoric acid M.E. indicates phosphoric acid monomethyl ester. Hierarchical clustering revealed separation of amino acids from products and intermediates of central metabolism. The former group largely decreased (cluster 1) while the latter group largely increased (cluster 2) with greening. The average accumulation profiles of the identified clusters (1 and 2) are shown in Figure 12. Species found also in blank samples are shown in gray (see “Materials and Methods”), and values higher than 1 or lower than −1 (outside of the color range limits) are boxed in red. See Figure 6 for heat map and clustering details.
Figure 12.
Figure 12.
Average accumulation kinetics for soluble metabolites belonging to clusters 1 and 2. Normalized average fold change for all apparent species belonging to cluster 1 and cluster 2. Values are shown with associated se. Cluster assignment is based on hierarchical clustering (Pearson, average linkage; Fig. 11). Cluster 1 predominately contains amino acids. Cluster 2 contains various products and intermediates of primary metabolism including many sugars. The apparent metabolic pause between 240 and 480 min may arise due to changes in the fresh to dry weight ration during this period: soluble metabolites were normalized to fresh weight, and the first major increase in the dry weight to fresh weight ratio occurred between 240 and 480 min (see Supplementary Fig. S4)
Figure 13.
Figure 13.
PCA of nucleus-encoded transcripts (A), plastid-encoded transcripts (B), lipids (C), and soluble metabolites (D). Control indicates samples not treated with extended dark treatment, taken at t = 0. Rep1, Rep2, and Rep3 indicate samples taken from the independently repeated experiments. PC1, which defines 40% to 60% of the variation in the nuclear transcript, lipid, and soluble metabolite data sets, separates data points in a manner that reflects the deetiolation time course. By contrast, the primary variance in plastid-encoded transcripts (PC1, 64.2%) does not reflect the greening process. The shift from the etiolated to the green state does not proceed in an even manner; instead, rapid shifts are seen, such as the change between 60 and 120 min for nuclear transcripts and between 480 and 960 min for metabolites. Importantly, control samples, which were harvested at the same time as samples 0, group rather with later time points, which have a similar green status. Probabilistic PCAs were undertaken in R studios using the pcaMethods package (Stacklies et al., 2007).
Figure 14.
Figure 14.
Accumulation of nucleus-encoded transcripts contributing to separation across PC1. A, Heat map (Pearson, average linkage) showing clustering of the top 500 nuclear transcripts contributing to separation across PC1 (Fig. 13). Note that 10.2% of elements are above (3.1%) or below (7.1%) the color scale limits. B, Average accumulation of transcripts in clusters defined by A. Points represent averages of all transcripts belonging to the clusters, with associated se.
Figure 15.
Figure 15.
Summary of the timing of changes associated with the greening process. The model presents a summary of the major changes observed during 6720 min (5 d) of greening following extended dark treatment of tobacco. The time course can be divided into two phases: a deetiolation phase, in which the plastid PLB is disassembled, and a building phase, which largely involves the accumulation of thylakoid membranes and associated photosynthetic proteins and capacity.

References

    1. Abramoff MD, Magalhães PJ, Ram SJ (2004) Image processing with ImageJ. Biophoton Int 11: 36–42
    1. Adam Z, Charuvi D, Tsabari O, Knopf RR, Reich Z (2011) Biogenesis of thylakoid networks in angiosperms: Knowns and unknowns. Plant Mol Biol 76: 221–234 - PubMed
    1. Aguettaz P, Seyer P, Pesey H, Lescure AM (1987) Relations between the plastid gene dosage and the levels of 16S rRNA and rbcL gene transcripts during amyloplast to chloroplast change in mixotrophic spinach cell suspensions. Plant Mol Biol 8: 169–177 - PubMed
    1. Albus CA, Ruf S, Schöttler MA, Lein W, Kehr J, Bock R (2010) Y3IP1, a nucleus-encoded thylakoid protein, cooperates with the plastid-encoded Ycf3 protein in photosystem I assembly of tobacco and Arabidopsis. Plant Cell 22: 2838–2855 - PMC - PubMed
    1. Aubert S, Curien G, Bligny R, Gout E, Douce R (1998) Transport, compartmentation, and metabolism of homoserine in higher plant cells: Carbon-13- and phosphorus-31-nuclear magnetic resonance studies. Plant Physiol 116: 547–557 - PMC - PubMed

Publication types