. 2019 Mar 12;10(1):1184.
doi: 10.1038/s41467-019-08927-2.

Structural basis for assembly of vertical single β-barrel viruses

Affiliations

Structural basis for assembly of vertical single β-barrel viruses

Isaac Santos-Pérez et al. Nat Commun. .

Abstract

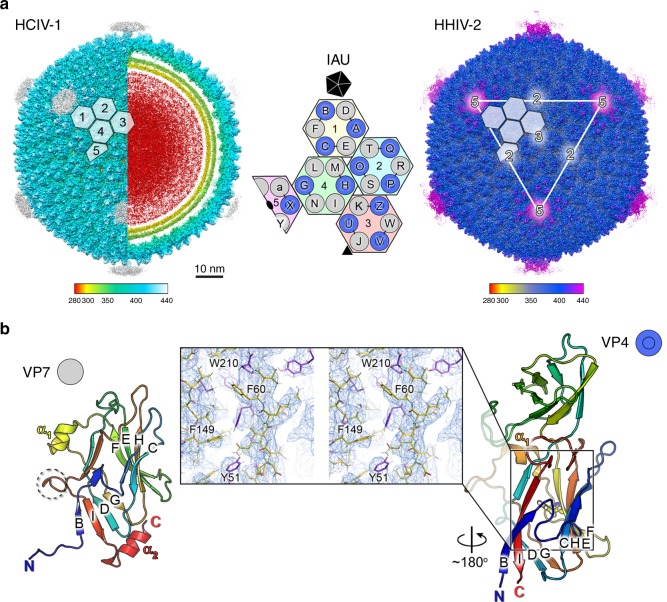
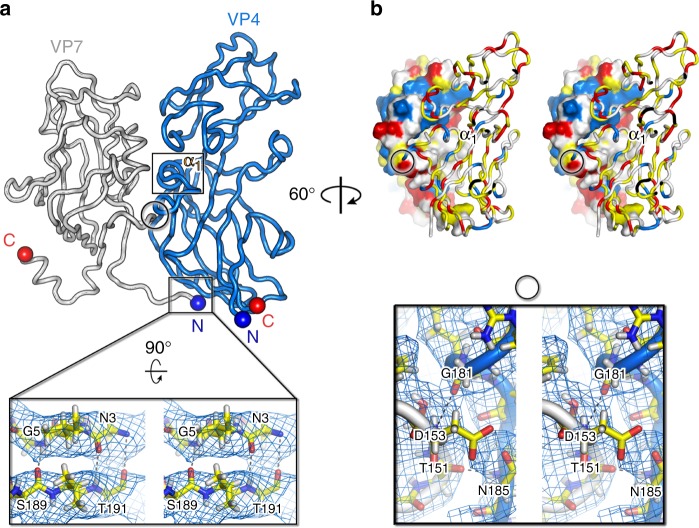
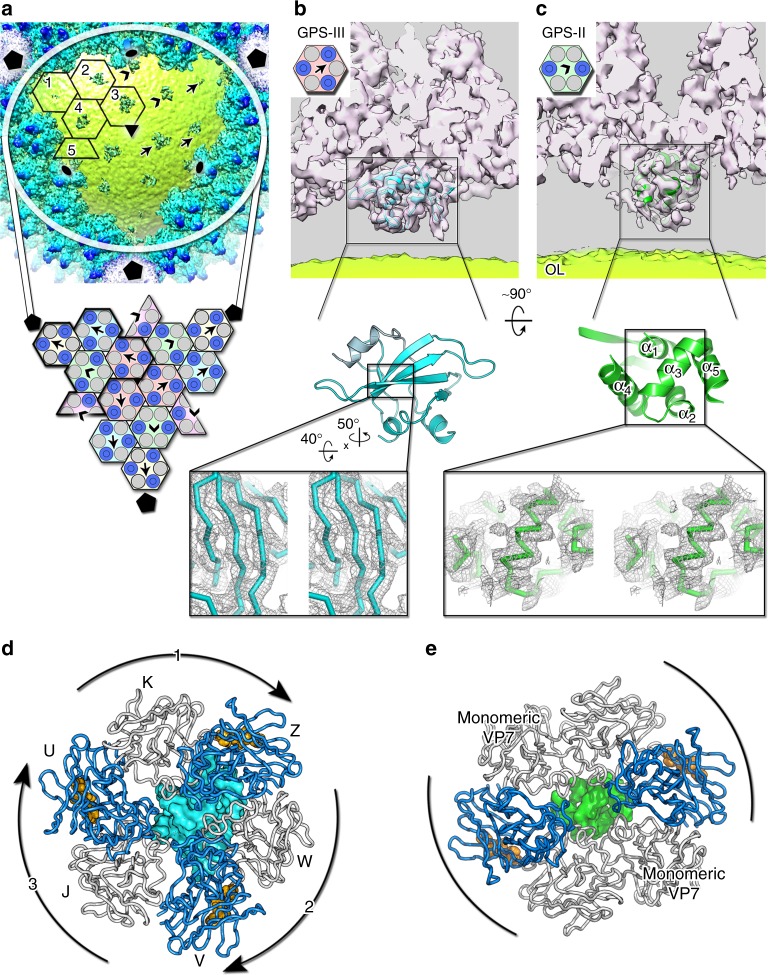
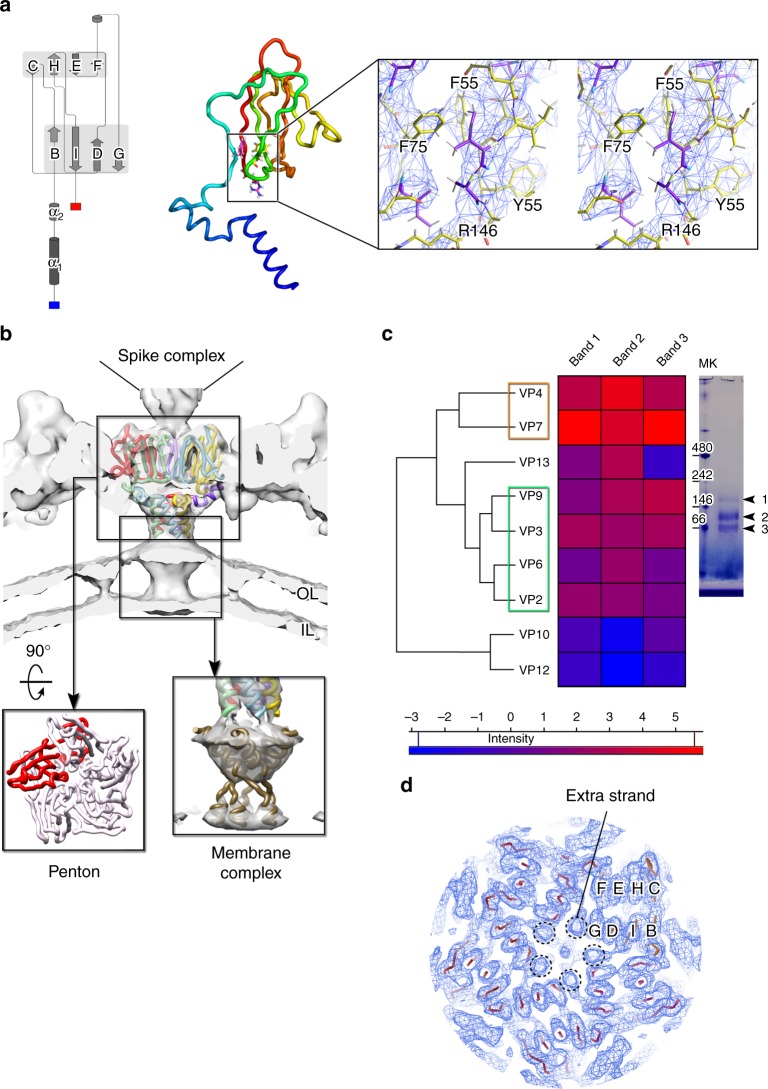
The vertical double β-barrel major capsid protein (MCP) fold, fingerprint of the PRD1-adeno viral lineage, is widespread in many viruses infecting organisms across the three domains of life. The discovery of PRD1-like viruses with two MCPs challenged the known assembly principles. Here, we present the cryo-electron microscopy (cryo-EM) structures of the archaeal, halophilic, internal membrane-containing Haloarcula californiae icosahedral virus 1 (HCIV-1) and Haloarcula hispanica icosahedral virus 2 (HHIV-2) at 3.7 and 3.8 Å resolution, respectively. Our structures reveal proteins located beneath the morphologically distinct two- and three-tower capsomers and homopentameric membrane proteins at the vertices that orchestrate the positioning of pre-formed vertical single β-barrel MCP heterodimers. The cryo-EM based structures together with the proteomics data provide insights into the assembly mechanism of this type of viruses and into those with membrane-less double β-barrel MCPs.


Conflict of interest statement

The authors declare no competing interests.

Figures

Fig. 1
Fig. 1
Cryo-EM density maps of HCIV-1 and HHIV-2 and MCPs. a Overall view of cryo-EM density maps of HCIV-1 (left) and HHIV-2 (right) color-coded by distance from the center (legend below). HCIV-1 is rendered to display the capsid shell (left-half) and the particle interior (right-half), genome in red and inner and outer membrane leaflets in yellow and yellow-lime (vertex complexes have been omitted, see Methods and Supplementary Figures 7 and 8). White-transparent hexagons on top of the capsid densities mark the capsomers (numbered in HCIV-1 Nos. 1–5) forming the icosahedral asymmetric unit (IAU); the white triangle and numbers on HHIV-2 surface mark a facet of the virion and the icosahedral symmetry axes, respectively. At the center, schematic of the capsomers organization with the three-tower capsomers (No. 1, light-yellow; No. 2, cyan; No. 3, pink), composed of three copies of MCP VP4 (blue circles) and three copies of MCP VP7 (light-gray circles) and with the two-tower capsomers (No. 4, light-green; No. 5, light-magenta; the latter sitting on the icosahedral two-fold axis) composed of two copies of VP4 and four copies of VP7; the five triangles composing the black pentagon represents the five copies of the penton protein plugging the vertices. Characters (A–X and a) identify each MCP subunit within the IAU and black short-lines joining the circles identify the VP7–VP4 heterodimers (see Fig. 2). b Cartoon representation of the HCIV-1 MCPs VP7 (left) with dashed-circle marking the loop with residues 149–154 [also marked in Fig. 2] and VP4 (right) with residue F149 colored in yellow and represented as stick; inset, stereoview of the region marked by a black rectangle with the VP4 atomic model (as stick and differently colored) fitted into the corresponding 3.7 Å resolution density map (blue mesh contoured at ∼3σ in COOT); some residues including F149 have been labeled
Fig. 2
Fig. 2
VP4–VP7 heterodimer. a Heterodimeric VP7–VP4 building block (VP7 in light gray; VP4 marine-blue) with interacting VP7 N-terminal residues. The black-circle marks the VP7 loop, residues 149–154 [indicated also as dashed black circle in (Fig. 1b) left] burying underneath the region underlying the VP4 α1 helix marked by a black rectangle, and contacting the VP4 loop, residues 181-184; blue and red spheres label the corresponding N-terminal and C-terminal. Inset, wall-eye stereoview of the main-chain hydrogen bond interactions (gray dashed lines) between the N-terminal residues of VP7 and residues of VP4 with corresponding density as blue mesh. b Top, surface and cartoon tube representation of VP7 and VP4, respectively, highlighting the charge distribution with the hydrophobic residues (A, G, V, I, L, F, M) colored in yellow, residues (R, K, H) positively charged in blue, residues (E, D) negatively charged in red and remaining polar residues in white. Bottom, wall-eye stereoview inset, suitably oriented, showing density as blue mesh and details of main-chain hydrogen bond interactions (black dashed lines) between the residues marked by the black circle in the above panels. Figure was generated in Pymol (https://pymol.org/2/)
Fig. 3
Fig. 3
GPS proteins beneath the capsid shell. a Top, cut-through density of a virus facet viewed along the icosahedral three-fold axis; arrows and arrowheads indicate the density (shades of blue) beneath the three-tower (Nos. 1–3, see Fig. 1a center) and two-tower (Nos. 4 and 5) capsomers (black hexagons), respectively. The outer leaflet (OL) of the membrane is in lime-yellow. Below, schematic of the capsomers composing the facet with one IAU outlined by a thicker black line (represented as in Fig. 1a). Pentagons, triangles and ovals mark the icosahedral symmetry five-fold, three-fold, and two-fold axes. b Top, side-view of the Gaussian filtered (1.4 Å width in Chimera) electron density (white 40% transparency) corresponding to the three-tower capsomer No. 3 close to the icosahedral three-fold axis (as from schematic, top left corner) with further density beneath marked by a black rectangle with the GPS-III poly-ALA model fitted in (cyan cartoon) and in lime-yellow the blurred membrane OL; the same atomic model at the center shows an orthogonal view of the GPS-III protein with an inset of a stereoview of the density (gray mesh contoured at ∼2σ in Pymol) corresponding to the resolved strands (black rectangle). c As b but corresponding to the density of the two-tower capsomer No. 4 (as from schematic, top left corner) with the additional density at its center as marked by the black rectangle corresponding to the five-helix bundle GPS-II protein (green cartoon). d Top view along the pseudo-three fold axis of MCPs composing the three-tower capsomers as cartoon tube color-coded as Fig. 2a with the off-centered GPS-III protein represented in cyan surface; labels identify the VP7–VP4 subunits and curved black arrow with numbers the putative order of docking/registering of the VP7–VP4 subunits onto the GPS-III. e As d but for the two-tower capsomers where the GPS-II (green surface) is centered with the α3 spanning the central cavity of the two-tower capsomers stapling together the opposite VP7–VP4 heterodimers (curved black lines) and leaving space for the docking of monomeric VP7
Fig. 4
Fig. 4
Interactions at the vertices. a Left, protein structure cartoon of HCIV-1 VP9 penton protein with the labeled jelly-roll strands; center, cartoon-tube representation of VP9 (rainbow coloring: N-terminus, blue; C-terminus, red) with inset showing a stereoview of the corresponding electron density region (as in Fig. 1b inset) marked by the black rectangle with in stick the residues F55, F75, Y55, and R146. b Five copies of VP9 models (yellow, magenta, cyan, green, and red) fitted into the corresponding HCIV-1 cryo-EM map (solid white and Gaussian filtered with 2.8 Å width) viewed perpendicular to the icosahedral five-fold axis. Inset on the left, view of the penton complex from the top (one VP9 subunit in red tube, the remaining four in white); inset on the right, the density region corresponding to the membrane protein plugging the membrane vesicle five-fold apices (contoured at higher threshold) and compatible with five copies of the C-terminal transmembrane helix of VP13 (brown tube; see below, Methods and Supplementary Figure 9a-b). c Heatmap depicting the hierarchical clustering (dendrogram on the left) where rows indicate the viral proteins detected according to their normalized abundance factor (NSAF) across the columns which represent the gel bands (arrowheads 1, 2, 3) cut from the representative native gel on the right (MK, markers in kDa). Color scale represents the intensity values as defined as I = log2 (NSAF) with blue = low abundance, red = high abundance. The orange and green rectangles mark, respectively, the clustering of the MCPs and the proteins composing the vertex complex with identified VP13 grouping closer to the vertex complex whereas proteins VP10 and VP12 are almost equidistant from the two major clusters. d View of the cryo-EM map as blue mesh (contoured as in Fig. 1b inset) viewed along the five-fold symmetry axis with fitted the Cα model of the penton in red and with one VP9 jelly-roll labeled as in a left; the dashed black circles mark the extra β-strands deriving from the above spike complex and that interact with the VP9 G strands

References

    1. Benson SD, Bamford JK, Bamford DH, Burnett RM. Viral evolution revealed by bacteriophage PRD1 and human adenovirus coat protein structures. Cell. 1999;98:825–833. doi: 10.1016/S0092-8674(00)81516-0. - DOI - PubMed
    1. Veesler D, et al. Atomic structure of the 75 MDa extremophile Sulfolobus turreted icosahedral virus determined by CryoEM and X-ray crystallography. Proc. Natl Acad. Sci. USA. 2013;110:5504–5509. doi: 10.1073/pnas.1300601110. - DOI - PMC - PubMed
    1. Laanto E, et al. Virus found in a boreal lake links ssDNA and dsDNA viruses. Proc. Natl Acad. Sci. USA. 2017;114:8378–8383. doi: 10.1073/pnas.1703834114. - DOI - PMC - PubMed
    1. Nandhagopal N, et al. The structure and evolution of the major capsid protein of a large, lipid-containing DNA virus. Proc. Natl Acad. Sci. USA. 2002;99:14758–14763. doi: 10.1073/pnas.232580699. - DOI - PMC - PubMed
    1. Abrescia NG, Bamford DH, Grimes JM, Stuart DI. Structure unifies the viral universe. Annu. Rev. Biochem. 2012;81:795–822. doi: 10.1146/annurev-biochem-060910-095130. - DOI - PubMed

Publication types

Substances

LinkOut - more resources