. 2019 Mar 12;9(1):4293.
doi: 10.1038/s41598-019-40223-3.

Engulfment, persistence and fate of Bdellovibrio bacteriovorus predators inside human phagocytic cells informs their future therapeutic potential

Affiliations

Engulfment, persistence and fate of Bdellovibrio bacteriovorus predators inside human phagocytic cells informs their future therapeutic potential

Dhaarini Raghunathan et al. Sci Rep. .

Abstract

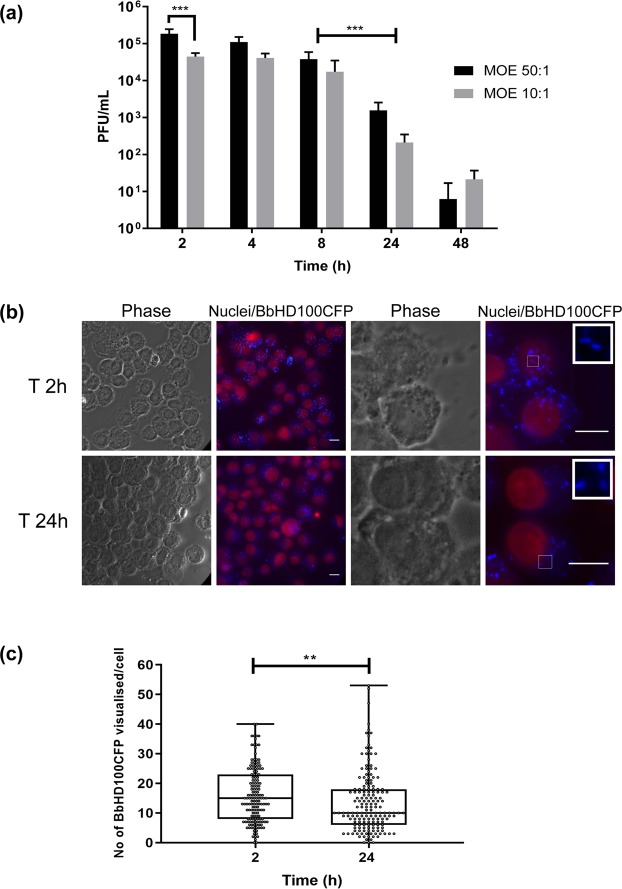
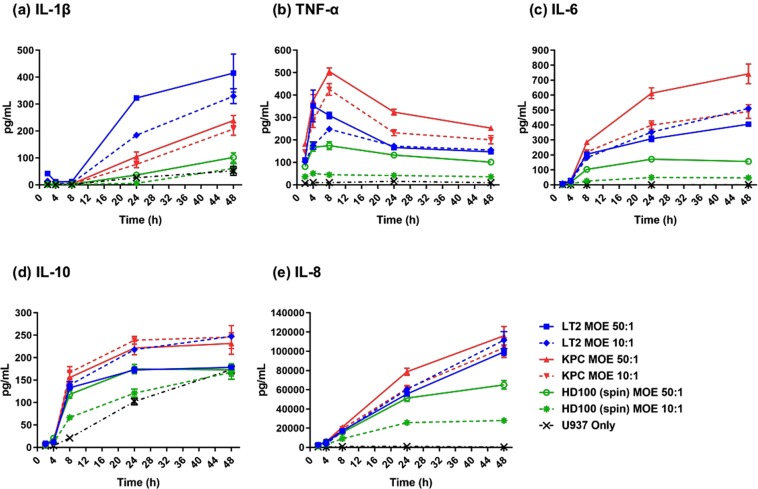
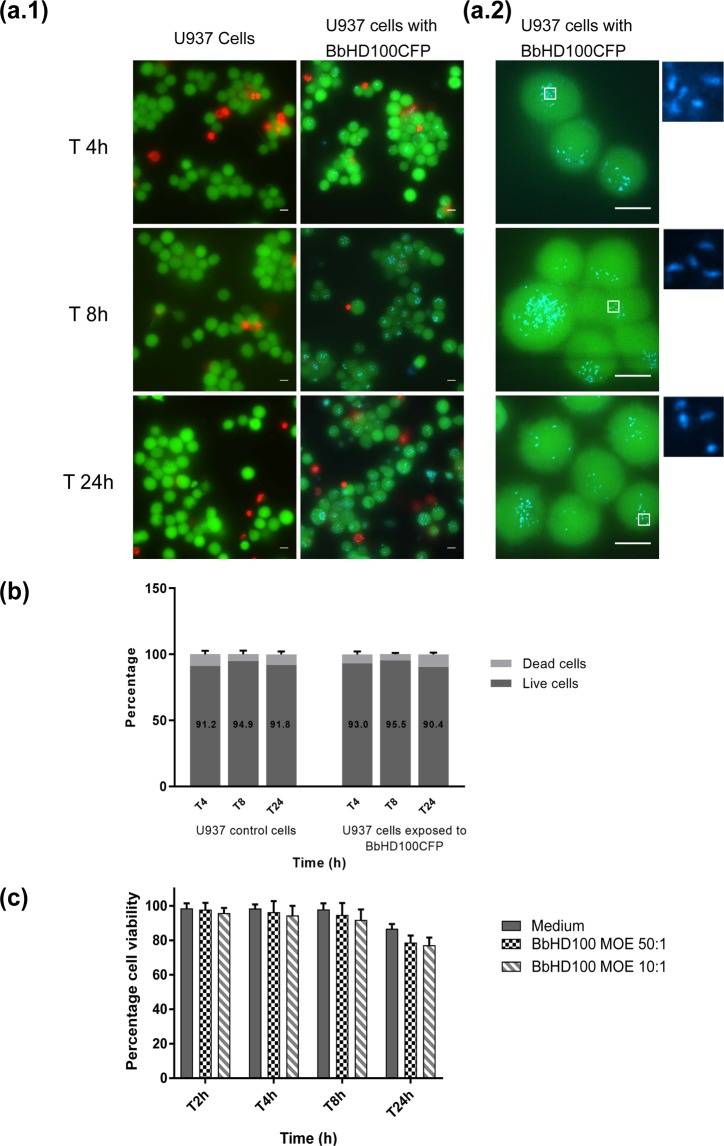
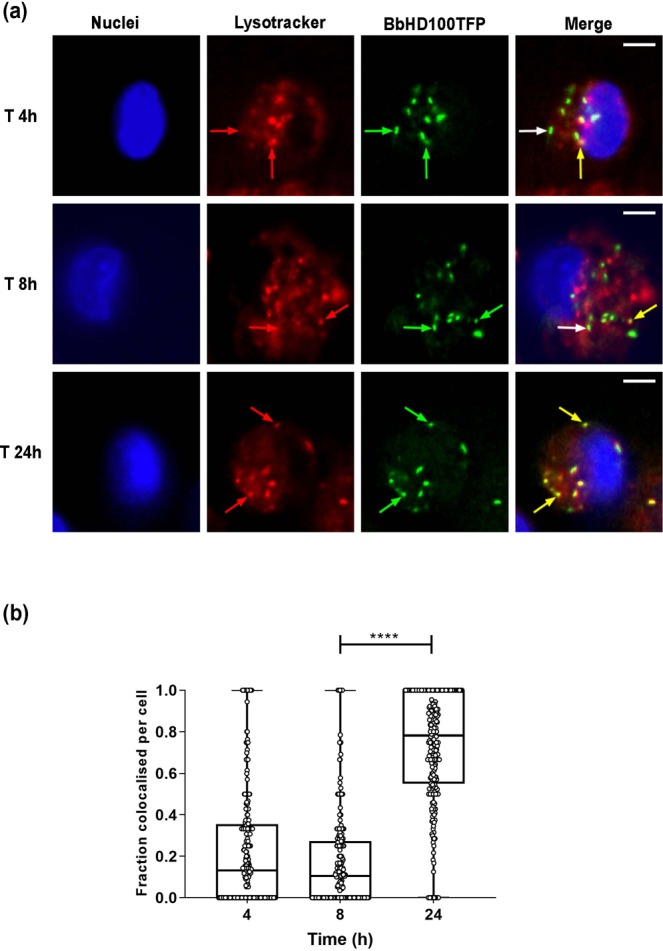
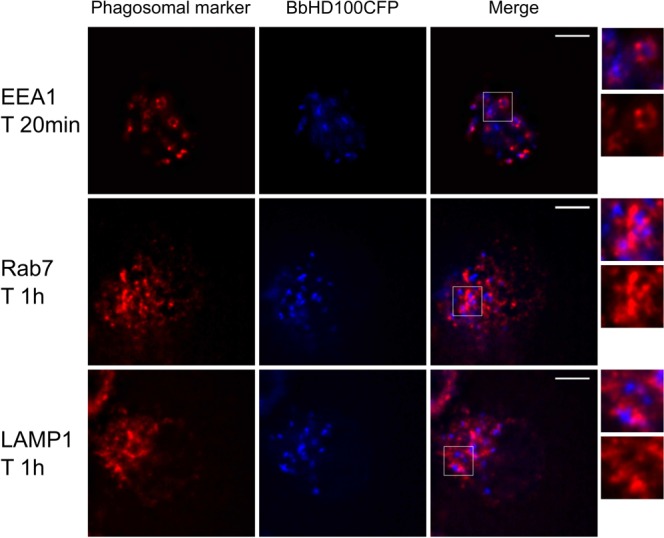
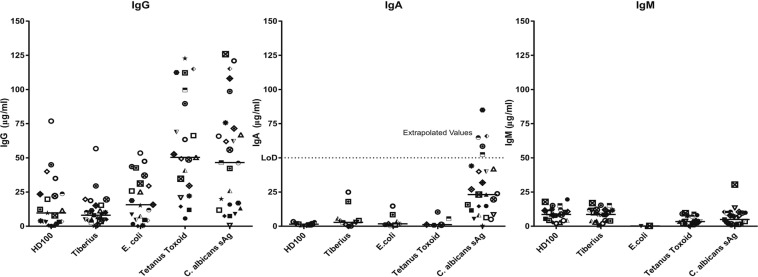
In assessing the potential of predatory bacteria, such as Bdellovibrio bacteriovorus, to become live therapeutic agents against bacterial infections, it is crucial to understand and quantify Bdellovibrio host cell interactions at a molecular level. Here, we quantify the interactions of live B. bacteriovorus with human phagocytic cells, determining the uptake mechanisms, persistence, associated cytokine responses and intracellular trafficking of the non-growing B. bacteriovorus in PMA-differentiated U937 cells. B. bacteriovorus are engulfed by U937 cells and persist for 24 h without affecting host cell viability and can be observed microscopically and recovered and cultured post-uptake. The uptake of predators is passive and depends on the dynamics of the host cell cytoskeleton; the engulfed predators are eventually trafficked through the phagolysosomal pathway of degradation. We have also studied the prevalence of B. bacteriovorus specific antibodies in the general human population. Together, these results quantify a period of viable persistence and the ultimate fate of B. bacteriovorus inside phagocytic cells. They provide new knowledge on predator availability inside hosts, plus potential longevity and therefore potential efficacy as a treatment in humans and open up future fields of work testing if predators can prey on host-engulfed pathogenic bacteria.


Conflict of interest statement

The authors declare no competing interests.

Figures

Figure 1
Figure 1
Persistence and survival of B. bacteriovorus inside U937 cells. (a) BbHD100 were exposed to U937 cells for 2 h at MOEs of 50:1 and 10:1. The predatory bacteria recovered from the U937 cells were enumerated at 2, 4, 8, 24 and 48 h. Data shown, as PFU/mL, are representative of mean ± standard deviation of two independent experiments, each set up in duplicate for U937-HD100 exposures and included technical replicates for bacterial-plaque enumerations (n = 8). ***corresponds to P = 0.0002. (b) Representative images of U937 cells containing BbHD100CFP at 2 and 24 hours. BbHD100CFP were exposed to U937 cells for 2 hours at a MOE of 50:1 and the U937 cells with predatory bacteria were fixed at 2 and 24 h. The images shown constitute whole cells (phase), snapshots of nuclei (stained with SiR-DNA, red) and maximum intensity 2D-projections of restored z-stack images of BbHD100CFP (blue). Scale bar −10 µm. Images are representative of two independent experiments, each set up in duplicate. In analysing images, no BbHD100CFP were observed as attached to the outside of the cells after the 2 h uptake. (c) BbHD100CFP inside U937 cells were counted from the restored z-stack images of fixed U937 cells with BbHD100CFP at 2 and 24 h from MOE 50:1 exposures. Data shown, as number of BbHD100CFP visualised per cell, are representative of one of the two independent experiments, each set up in duplicate and a minimum of 150 cells were analysed at each time point from each experiment (n = 150 cells per experiment). **corresponds to P = 0.0060.
Figure 2
Figure 2
Role of cytoskeleton in the uptake of B. bacteriovorus by U937 cells. (a) U937 cells pretreated with actin depolymerising agent, cytochalasin D (10 µM) for 1 h were exposed to BbHD100TFP (green) for 2 h at an MOE of 50 bacteria per cell in the presence of inhibitors or carrier (DMSO) and fixed. The actin filaments of fixed cells were stained with Rhodamine-phalloidin (false coloured in cyan), the nuclei were stained with SiR-DNA (red) and imaged. Shown are the maximum intensity 2D-projections (Stacks 1–20 used for both control and cytochalasin D treated cells) of the restored z-stack images. Scale bar −5 µm. Images are representative of two independent experiments. (b) U937 cells pretreated with microtubule inhibitor, Nocodazole (2.5 µM) for 1 h were exposed to BbHD100TFP (green) for 2 h at a MOE of 50 bacteria per cell in the presence of inhibitor or carrier (DMSO) and fixed. The microtubules of the fixed cells were stained with anti-tubulin primary antibody and Alexa 555 secondary antibody (false coloured in magenta), nuclei were stained with SiR-DNA (red) and imaged. Shown are the maximum intensity 2D-projections (Stacks 5–25 for both control and Nocodazole treated cells) of the restored images. Scale bar −5 µm. Images are representative of two independent experiments. (c) B. bacteriovorus detected inside U937 cells that were exposed to BbHD100TFP for 2 hours at a MOE of 50 bacteria per cell in the presence of cytoskeletal inhibitors or carrier, DMSO were counted from the restored z-stack images of fixed and immunostained cells. Data shown, as number of BbHD100TFP visualised per cell, are representative of one of the two independent experiments, each set up in duplicate and a minimum of 125 cells were analysed from each experiment. ****corresponds to P < 0.0001. (d) U937 cells, pretreated with inhibitors, were exposed to BbHD100 for 2 hours at a MOE of 50 bacteria per cell, in the presence of inhibitors. Bacteria were recovered from U937 cells at 2 and 4 h and enumerated by bacterial-plaque assay. Data shown, as PFU/mL, are representative of mean ± standard deviation of three independent experiments, each set up in duplicate for U937-BbHD100 exposures and included technical replicates for bacterial-plaque enumerations (n = 12). At 2 h, for Control (DMSO) vs Cytochalasin D, *corresponds to P = 0.0164 and for Control (DMSO) vs Nocodazole, *corresponds to P = 0.0195. At 4 h, for Control (DMSO) vs Cytochalasin D or Nocodazole, ****corresponds to P < 0.0001.
Figure 3
Figure 3
Cytokine responses induced by B. bacteriovorus in comparison to pathogens S. Typhimurium LT2 and K. pneumoniae KPC. BbHD100, S. Typhimurium LT2 and K. pneumoniae KPC were exposed to U937 cells by synchronous spin-assisted uptake at MOEs of 50:1 and 10:1 and cell culture supernatants were collected at various time points as illustrated in Fig. S1. The levels of cytokines (IL-1β (a), TNF-α (b), IL-6 (c), IL-10 (d) and IL-8 (e)) present in the supernatants of the bacteria-exposed U937 cells, collected at 2, 4, 8, 24 and 48 h, were measured by ELISA set up in triplicates for each individual supernatant sample collected. For pathogens, the 2-hour time points in all panels represent cytokines produced during gentamycin treatment and the subsequent time points show cumulative cytokine production from 2 h onwards. The cytokine concentrations shown as pg/mL are representative of mean ± standard error of values from three (BbHD100 and K. pneumoniae KPC (n = 18)) or two (S. Typhimurium LT2 (n = 12)) independent experiments, each set up with two technical replicates for U937-predatory/pathogenic bacteria exposures.
Figure 4
Figure 4
Viability of U937 cells exposed to B. bacteriovorus. BbHD100CFP were exposed to U937 cells for 2 h at a MOE of 50:1 and the exposed U937 cells were stained with Calcein (live cells, green) and EthD-1 (dead cells, red) and imaged live at 4, 8 and 24 h. (a) Shown are representative images of live/dead stained control and BbHD100CFP containing U937 cells at 4, 8 and 24 h. The images were generated by merging snapshots of live and dead cells stained with Calcein AM (green) and EthD-1 (red) with/without BbHD100CFP, imaged as z-stacks, restored and 2D projected at maximum intensity (blue). Scale bar −10 µm. The images were acquired using 60x lens (a.1) and 100x lens (a.2). (b) Percentage of live and dead cells: the stained live and dead cells that were exposed to BbHD100CFP were counted and the percentages of each population of cells present were calculated. The percentage of live and dead cells counted at different time points in the control and BbHD100CFP exposed U937 cells were not significantly different (Live cells – P < 0.0934, Dead cells – P < 0.1292). Data shown, as percentages, are representative of mean ± standard deviation of three independent experiments (n = 3). A minimum of 200 cells were counted from each independent experiment at each time point. (c) U937 cell viability was assessed by measurement of LDH released from damaged cells into the culture supernatants at 2, 4, 8 and 24 h from control and BbHD100 predator exposed cells. The data shown are representative of mean ± standard deviation of values from at least three independent experiments.
Figure 5
Figure 5
Trafficking of B. bacteriovorus inside U937 cells. BbHD100TFP were exposed to U937 cells for 2 hours at a MOE of 50:1 and the acidic vacuoles of the cells were labelled with LysoTracker red DND-99 and imaged live at 4, 8 and 24 h. (a) Shown are representative images (single slices from restored z-stacks) of U937 cells (Nuclei stained with Vybrant DyeCycle Violet, blue) containing BbHD100TFP (green) with labelled acidic vacuoles (red) at 4, 8 and 24 h from one of the two independent experiments. The red and green arrows in the LysoTracker and BbHD100TFP channels point to specific acidic vacuoles and BbHD100TFP respectively. The yellow/white arrows in the merged images show colocalisation/no colocalisation respectively of predatory bacteria with the acidic vacuoles. Scale bar −5 µm. (b) Box plots with each point corresponding to the fraction of bacteria colocalising with the labelled acidic vacuoles in a cell at the time points, 4, 8 and 24 h. A minimum of 100 cells with predatory bacteria were analysed in each experiment at each time point and the data shown are the combined values from two independent experiments (n = 100 cells per experiment). ****corresponds to P < 0.0001. Video 1 (a and other samples). Video of z-stack images taken across U937 cells (one taken from (a) above) with HD100TFP and labelled with LysoTracker red DND-99 at 4, 8 and 24 h time points. Video 1a corresponds to experiment 1 and video 1b corresponds to experiment 2.
Figure 6
Figure 6
Colocalisation of B. bacteriovorus with early and late phagosomal markers. BbHD100CFP were exposed to U937 cells for 15 min at a MOE of 200:1 in a smaller volume (200 µl) to promote rapid uptake of the predatory bacteria. The cells fixed at time points, 20 min, 40 min, 1 h and 2 h were immunostained for the early phagosomal marker EEA1 and late phagosomal markers Rab7 and LAMP1. Shown are the representative maximum intensity 2D-projections of restored z-stack images of U937 cells with BbHD100CFP (blue), immunostained for the phagosomal markers (false coloured in red), taken at time points 20 minutes (EEA1) and 1 h (Rab7 and LAMP1). The magnified images of the merged panel are representative regions showing the predatory bacteria colocalising with the phagosomal markers. A minimum of 100 cells with BbHD100CFP were analysed at each time point to study colocalisation of predators with phagosomal markers. Scale bar −5 µm.
Figure 7
Figure 7
Prevalence of antibodies against B. bacteriovorus in general human populations. Human serum samples obtained from the Nottingham Health Services Biobank were tested for the presence of antibodies (IgG, IgM and IgA) against BbHD100 and BbTiberius by direct antigen ELISA with streptavidin-biotin detection. Written consent was obtained from all patients and the study was approved by North West 7 REC – Greater Manchester Central (ethics reference 15/NW/0685). Lysed BbHD100 and BbTiberius with total cell protein matched to lysed E. coli control (10 µg/ml) were used as coating antigens. The recall antigens, Tetanus toxoid (2 LF/ml) and Candida albicans surface antigen (1 µg/ml) were used as positive controls for antibody presence for the ELISA. Data shown are the antibody responses analysed from 25 different serum samples and median values for each antigen are represented as a line. Dotted line, denoted LOD represents the upper limit of detection for IgA; 5 values for C. albicans IgA only, were higher than the top standard and so were extrapolated. All other IgA and all IgG and IgM values were within the standard curve.

References

    1. Sugden R, Kelly R, Davies S. Combatting antimicrobial resistance globally. Nat Microbiol. 2016;1:16187. doi: 10.1038/nmicrobiol.2016.187. - DOI - PubMed
    1. Turnidge J, Baggoley C, Schipp M, Martin R. Resistance sans frontieres: containing antimicrobial resistance nationally and globally. Med J Aust. 2016;204:207–208. doi: 10.5694/mja15.01304. - DOI - PubMed
    1. WHO. Antibacterial agents in clinical development: An analysis of the antibacterial clinical development pipeline, including tuberculosis. (2017).
    1. Allen HK, Trachsel J, Looft T, Casey TA. Finding alternatives to antibiotics. Ann N Y Acad Sci. 2014;1323:91–100. doi: 10.1111/nyas.12468. - DOI - PubMed
    1. Sockett RE, Lambert C. Bdellovibrio as therapeutic agents: a predatory renaissance? Nat Rev Microbiol. 2004;2:669–675. doi: 10.1038/nrmicro959. - DOI - PubMed

Publication types