. 2019 Mar 12;9(1):4299.
doi: 10.1038/s41598-019-40683-7.

The effect of endothelial nitric oxide synthase on the hemodynamics and wall mechanics in murine arteriovenous fistulas

Affiliations

The effect of endothelial nitric oxide synthase on the hemodynamics and wall mechanics in murine arteriovenous fistulas

Daniel Pike et al. Sci Rep. .

Erratum in

Abstract

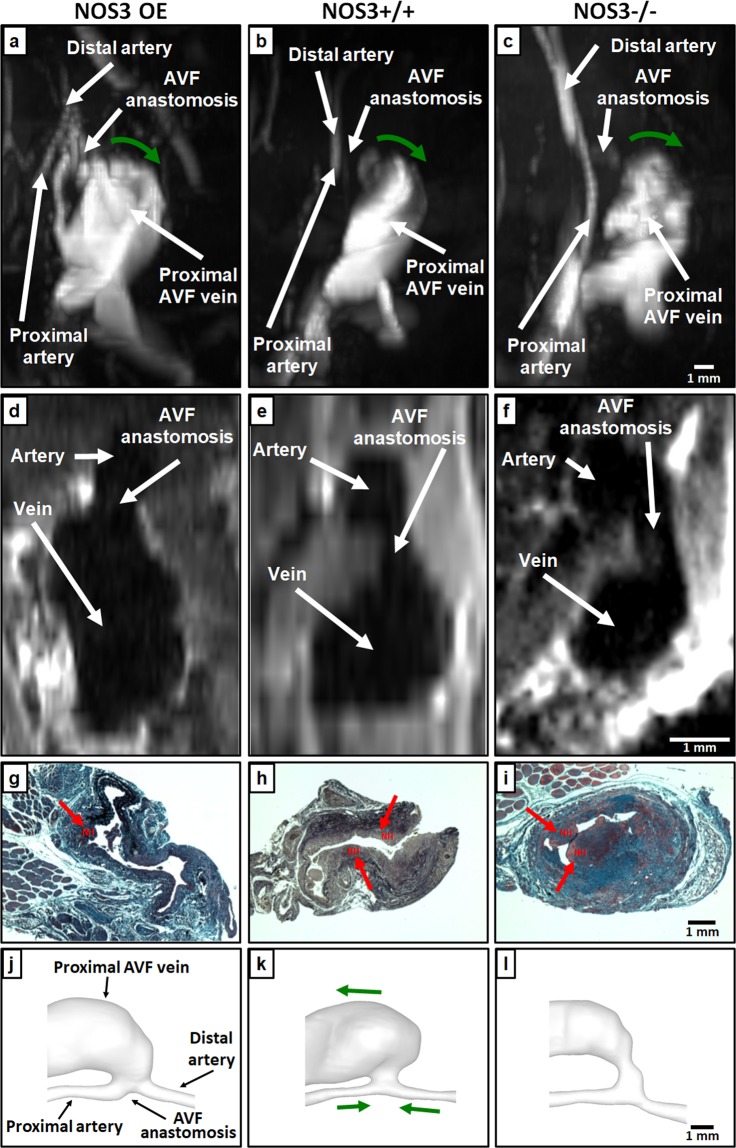
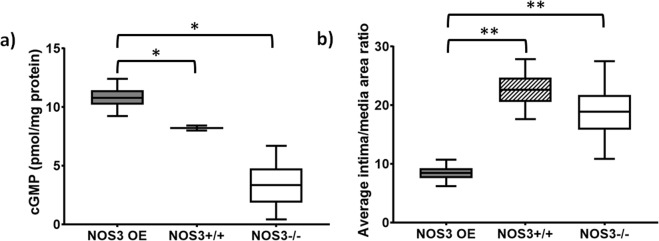
Creation of a hemodialysis arteriovenous fistula (AVF) causes aberrant vascular mechanics at and near the AVF anastomosis. When inadequately regulated, these aberrant mechanical factors may impede AVF lumen expansion to cause AVF maturation failure, a significant clinical problem with no effective treatments. The endothelial nitric oxide synthase (NOS3) system is crucial for vascular health and function, but its effect on AVF maturation has not been fully characterized. We hypothesize that NOS3 promotes AVF maturation by regulating local vascular mechanics following AVF creation. Here we report the first MRI-based fluid-structure interaction (FSI) study in a murine AVF model using three mouse strains: NOS3 overexpression (NOS3 OE) and knockout (NOS3-/-) on C57BL/6 background, with C57BL/6 as the wild-type control (NOS3+/+). When compared to NOS3+/+ and NOS3-/-, AVFs in the OE mice had larger lumen area. AVFs in the OE mice also had smoother blood flow streamlines, as well as lower blood shear stress at the wall, blood vorticity, inner wall circumferential stretch, and radial wall thinning at the anastomosis. Our results demonstrate that overexpression of NOS3 resulted in distinct hemodynamic and wall mechanical profiles associated with favorable AVF remodeling. Enhancing NOS3 expression may be a potential therapeutic approach for promoting AVF maturation.


Conflict of interest statement

The authors declare no competing interests.

Figures

Figure 1
Figure 1
MRI images, histological images and lumen geometrical models at 21 days after AVF creation. 2D time of flight MRI images of NOS3 OE (a) NOS3+/+ (b) and NOS3−/− (c) mice. Green arrows indicate the direction of blood flow in the proximal AVF vein. Scale bar in (c) also applies to (a) and (b) 3D multiplanar black-blood MRI images of NOS3 OE (d), NOS3+/+ (e) and NOS3−/− (f) mice. Scale bar in (f) also applies to (d) and (e) Russell-Movat pentachrome-stained proximal AVF vein histological images for NOS3 OE (g), NOS3+/+ (h), and NOS3−/− (i) mice. Red arrows point to the venous neointimal hyperplasia (NH). Scale bar in (i) also applies to (g) and (h). The lumen geometrical models of the AVFs of NOS3 OE (j), NOS3+/+ (k) and NOS3−/− (l) mice for simulations. The labeling of blood vessels in (j) the green arrows in (k) (which indicate the direction of blood flow) and the scale bar in (l) applies to all 3 lumen geometrical models. Note the presence of backflow in the distal artery in all three mice, which is the same to what we observed in AVFs in hemodialysis patients.
Figure 2
Figure 2
Averaged AVF hemodynamics at 21 days after creation. Box plots of velocity (a) Reynolds number (b) fluid shear stress at the AVF wall (i.e., τw) (c), vorticity (d), relative helicity (e), and Q-criterion (f) were averaged over both a cardiac cycle and the first 7 mm of the proximal AVF vein starting from the anastomosis (140 cross-sectional slices, with 50 μm between 2 slices) in the lumen geometrical models shown in Fig. 1(j–l). Box plots show 25th to 75th percentile, with whiskers of 5% and 95% of data range. *p < 0.05; **p < 0.01; ***p < 0.001. Baseline (i.e., pre-surgery jugular vein in NOS3+/+ mice) values were: velocity = 0.04 ± 0.02 cm/s; Reynolds number = 0.2 ± 0.1; τw = 1.0 ± 0.3 dyne/cm2; vorticity = 20.4 ± 10.3 1/s; relative helicity = 0.005 ± 0.03; Q-criterion = 1.3 ± 18.7 1/s2.
Figure 3
Figure 3
Hemodynamics at the AVF anastomosis at 21 days after creation. Color maps of the velocity (1st panel), luminal and wall fluid shear stress (FSS) (2nd panel), vorticity (3rd panel), relative helicity (4th panel) and Q-criterion (5th panel) at Slice 1 (indicated by the dashed black line in the lumen geometrical models), which is a cross-section located at the AVF anastomosis, during systole. Scale bar in (o) applies to (a–o). Color scales are set to best contrast the differences among the three mice.
Figure 4
Figure 4
Hemodynamics at the AVF anastomosis junction at 21 days after creation. Color maps of the velocity (1st panel), luminal and wall fluid shear stress (FSS) (2nd panel), vorticity (3rd panel), relative helicity (4th panel) and Q-criterion (5th panel) at Slice 2 (indicated by the dashed black line in the lumen geometrical models), which is a cross-section located at the AVF anastomosis junction where sutures were placed, during systole. Scale bar in (o) applies to (a–o). Color scales are set to best contrast the differences among the three mice.
Figure 5
Figure 5
Hemodynamics at the proximal AVF vein at 21 days after creation. Color maps of the velocity (1st panel), luminal and wall fluid shear stress (FSS) (2nd panel), vorticity (3rd panel), relative helicity (4th panel) and Q-criterion (5th panel) at Slice 3 (indicated by the dashed black line in the lumen geometrical models), which is a cross-section located at the proximal AVF vein, during systole. Scale bar in (o) applies to (a–o). Color scales are set to best contrast the differences among the three mice.
Figure 6
Figure 6
Averaged AVF inner wall circumferential stretch and radial wall thinning at 21 days after creation. The maximum inner wall circumferential stretch within a cardiac cycle at each cross-sectional slice was averaged over either 7 or 1 mm at the indicated region. The radial wall thinning was averaged around the circumference of each slice first; next, the maximum radial wall thinning within a cardiac cycle at each slice was averaged over either 7 or 1 mm at the indicated region. The distance between 2 slices is 50 μm. Box plots of the maximum inner wall circumferential stretch of the 7-mm AVF (a), 1-mm AVF anastomosis (c), 1-mm AVF anastomosis junction (e) and 1-mm proximal AVF vein (g). Box plots of maximum radial wall thinning of the 7-mm AVF (b), 1-mm AVF anastomosis (d), 1-mm AVF anastomosis junction (f) and 1-mm proximal AVF vein (h). Box plots show 25th to 75th percentile, with whiskers of 5% and 95% of data range. *p < 0.05; **p < 0.01; ***p < 0.001. Baseline (i.e., pre-surgery jugular vein in NOS3+/+ mice) values were: maximum inner wall circumferential stretch = 0.02 ± 0.004%; maximum radial wall thinning = 0.01 ± 0.003 μm.
Figure 7
Figure 7
AVF luminal pressure over the cardiac cycle from the FSI simulations of NOS3 OE (a), NOS3+/+ (b), and NOS3−/− (c) mice. In the top panel, the labeling of the blood vessels in NOS3 OE, green arrows in NOS3+/+ (which indicate the direction of blood flow) and the scale bar in NOS3−/− apply to all three mice. Pressure is averaged over the cross-sectional area of each slice indicated in the top panel: Slice 1 is located at the AVF anastomosis, Slice 2 is located at the AVF anastomosis junction, and Slice 3 is located at the proximal AVF vein.
Figure 8
Figure 8
Radial wall thinning and luminal pressure at the AVF anastomosis, AVF anastomosis junction, and proximal AVF vein at 21 days after creation. In the top panel, the labeling of the blood vessels in NOS3 OE, green arrows in NOS3+/+ (which indicate the direction of blood flow) and the scale bar in NOS3−/− apply to all three mice. In (ai), the lumen of cross-sections at Slices 1 (located at the AVF anastomosis), 2 (located at the AVF anastomosis junction), and 3 (located at proximal AVF vein) is filled with a color map of luminal pressure, and the wall is colored with the magnitude of radial wall thinning, both during systole. The coordinates in (a) and the scale bar in (i) apply to (ai). In (jl), line charts of radial wall thinning during systole are graphed along the circumference of the wall, using the coordinates shown in (a).
Figure 9
Figure 9
The levels of cGMP and the intima/media area ratios in the AVFs at 21 days after creation. (a) NOS3 OE mice had significantly increased cGMP levels when compared to NOS3+/+ and NOS3−/− mice. (b) NOS3 OE mice had significantly decreased intima/media area ratios when compared to NOS3+/+ and NOS3−/− mice. Data are expressed as mean± SEM. N = 3–4 per group. *Indicates p = 0.05 and **indicates p = 0.0005 when compared to NOS3+/+ and NOS3−/− by ANOVA.

References

    1. Gibson KD, et al. Vascular access survival and incidence of revisions: a comparison of prosthetic grafts, simple autogenous fistulas, and venous transposition fistulas from the United States Renal Data System Dialysis Morbidity and Mortality Study. J Vasc Surg. 2001;34:694–700. - PubMed
    1. Allon M, et al. Relationships Between Clinical Processes and Arteriovenous Fistula Cannulation and Maturation: A Multicenter Prospective Cohort Study. American Journal of Kidney Diseases. 2018;71:677–689. - PMC - PubMed
    1. Lee T, et al. Decreased Cumulative Access Survival in Arteriovenous Fistulas Requiring Interventions to Promote Maturation. Clin J Am Soc Nephro. 2011;6:575–581. - PMC - PubMed
    1. Astor BC, et al. Type of vascular access and survival among incident hemodialysis patients: the Choices for Healthy Outcomes in Caring for ESRD (CHOICE) Study. J Am Soc Nephrol. 2005;16:1449–1455. - PubMed
    1. Lok CE, et al. Cumulative patency of contemporary fistulas versus grafts (2000–2010) Clin J Am Soc Nephrol. 2013;8:810–818. - PMC - PubMed

Publication types

Substances