. 2019 Mar 12;10(1):952.
doi: 10.1038/s41467-019-08750-9.

Noninvasive sub-organ ultrasound stimulation for targeted neuromodulation

Affiliations

Noninvasive sub-organ ultrasound stimulation for targeted neuromodulation

Victoria Cotero et al. Nat Commun. .

Erratum in

Abstract

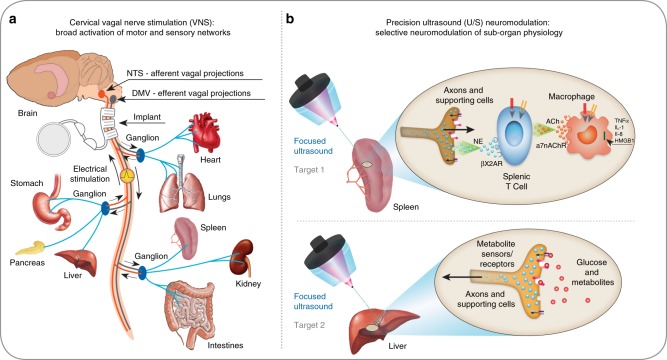
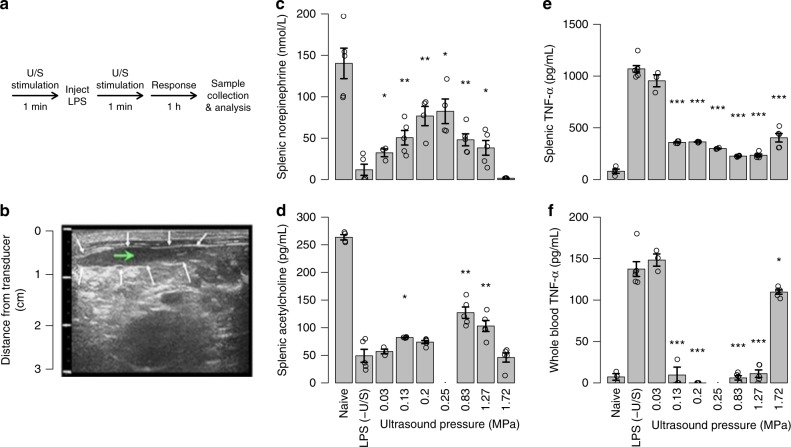
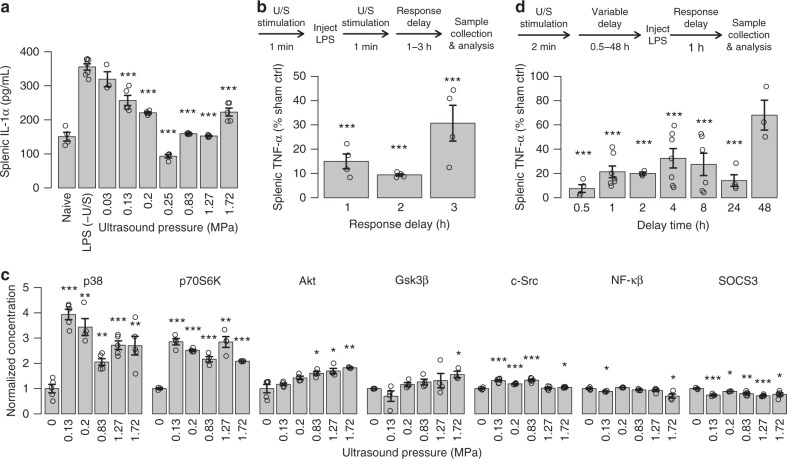
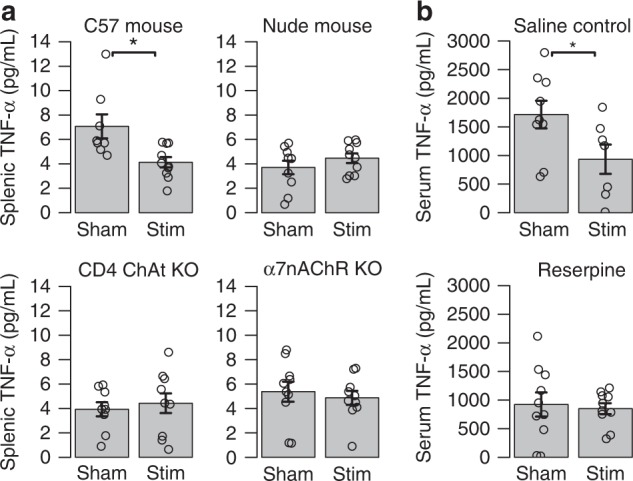
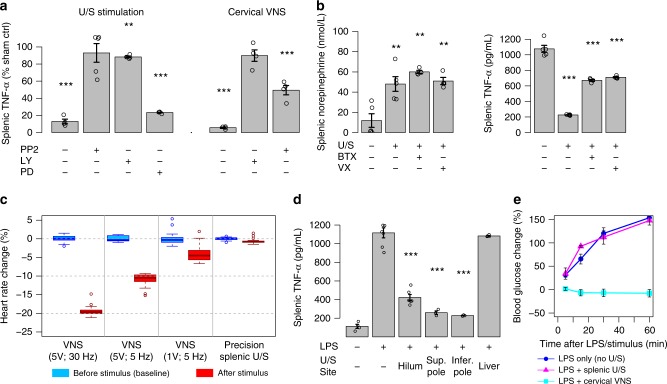
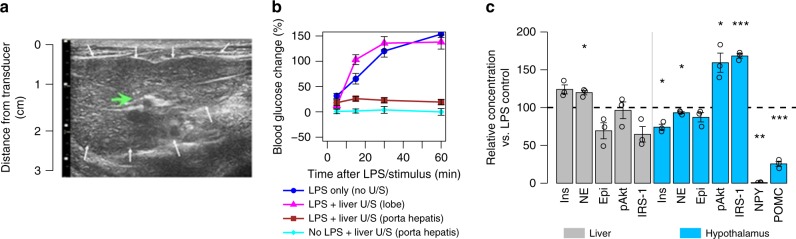
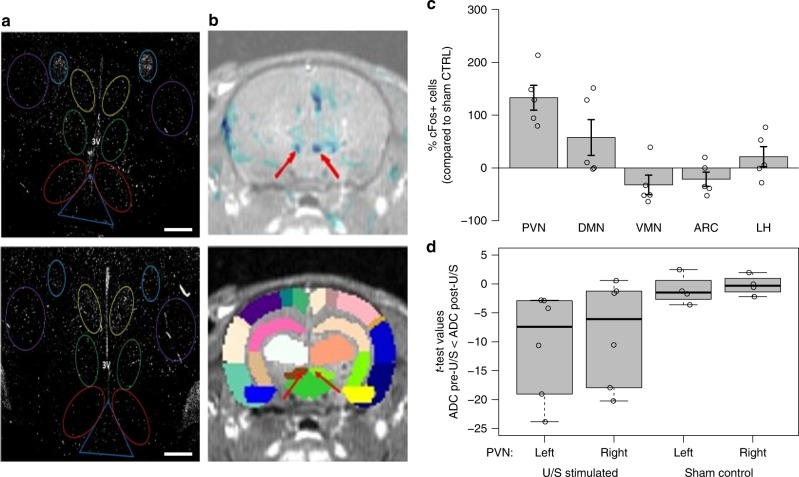
Tools for noninvasively modulating neural signaling in peripheral organs will advance the study of nerves and their effect on homeostasis and disease. Herein, we demonstrate a noninvasive method to modulate specific signaling pathways within organs using ultrasound (U/S). U/S is first applied to spleen to modulate the cholinergic anti-inflammatory pathway (CAP), and US stimulation is shown to reduce cytokine response to endotoxin to the same levels as implant-based vagus nerve stimulation (VNS). Next, hepatic U/S stimulation is shown to modulate pathways that regulate blood glucose and is as effective as VNS in suppressing the hyperglycemic effect of endotoxin exposure. This response to hepatic U/S is only found when targeting specific sub-organ locations known to contain glucose sensory neurons, and both molecular (i.e. neurotransmitter concentration and cFOS expression) and neuroimaging results indicate US induced signaling to metabolism-related hypothalamic sub-nuclei. These data demonstrate that U/S stimulation within organs provides a new method for site-selective neuromodulation to regulate specific physiological functions.


Conflict of interest statement

V.C., Y.F., I.H., P.F., K.W., S.K., J.G., W.R., T.-J.K., J.R., C.B., S.J., J.A. and C.P. are employees of General Electric and declare that GE has filed US and international patent applications describing methods, devices, and systems for precision organ-based U/S neuromodulation. T.T., A.M.K., T.R.C., S.Z., K.J.T. and S.S.C. declare that GE provided funds to support their work associated with this manuscript. All other authors declare no competing interests.

Figures

Fig. 1
Fig. 1
Implant-based vagus nerve stimulation (VNS) versus precision ultrasound (U/S) neuromodulation. a A schematic of the neurons within the vagus nerve, exemplary innervated organs, and the common cervical position used for VNS devices. Stimulation of the cervical vagus results in stimulation of both target and non-target efferent and afferent pathways. Clinical implementation of miniature stimulators and advanced electrode designs that can be implanted closer to the target organ (for precision stimulation of axons entering only that organ) is challenging and remains elusive,,. b A schematic of precision organ-based neuromodulation in which the innervation points of known axonal populations are targeted for stimulation using focused pulsed U/S. Targets investigated herein include innervation points within the spleen and sensory terminals within the liver
Fig. 2
Fig. 2
Splenic U/S neuromodulation of the cholinergic anti-inflammatory pathway (CAP). a The timeline of the U/S neuromodulation performed in the LPS-induced inflammation model (see Methods and Supplementary Figures 1–6 for details; stimulation parameters were 1.1 MHz, 136.36 µs pulse length, and 0.5 ms pulse repetition period). b Example U/S image of the spleen used to locate the U/S stimulus (white arrows—outline of the spleen; green arrow—target point for U/S stimulation). ce Splenic concentrations of CAP signaling molecules, including norepinephrine (c), acetylcholine (d), and TNF (e) are shown for naive animals, sham controls (LPS, -U/S), and with U/S stimulation (0.03–1.72 MPa). f Whole-blood concentrations of TNF for the same conditions as (e). The asterisks mark statistical significance using two-sided t-test versus LPS only controls (with p-value thresholds; *p < 0.05, **p < 0.01, ***p < 0.001). n = 5 for all experiments in this figure except for all LPS − (U/S) controls which were n = 7
Fig. 3
Fig. 3
Lasting effect of splenic U/S neuromodulation. a Splenic IL-1α concentrations measured from the same samples as Fig. 2c–e. n = 5 for all experimental conditions, except LPS–(U/S) controls which were n = 7. b Study timeline and data designed to measure the concentrations of splenic TNF after response times of 1–3 h (i.e., the time the sample was harvested post treatment). n = 4 for each experimental condition. c Normalized concentrations (compared to LPS controls) of activated/phosphorylated kinases with or without U/S stimulus pressures from 0.03 to 1.72 MPa. n = 4 for each experimental condition. d Concentration of splenic TNF after protective (pre-LPS) U/S treatments after delay times from 0.5 to 48 h prior to LPS injection. n = 5. The asterisks mark statistical significance using two-sided t-test versus LPS only controls (with p-value thresholds; *p < 0.05, **p < 0.01, ***p < 0.001). All experiments in this figure were performed using the same US settings as in Fig. 2 (0.83 MPa)
Fig. 4
Fig. 4
Splenic U/S stimulation suppresses systemic TNF levels during endotoxemia through CAP. a Splenic concentrations of TNF are shown for sham controls (LPS, -U/S) and U/S stimulated mice (0.83 MPa ultrasound setting) for C57black/6 mice, Nude mice, CD4 ChAT knock-out mice, and α7nAChR knock-out mice. b Serum TNF concentrations are shown for sham controls (LPS, -U/S) and U/S stimulated mice (0.83 MPa) ultrasound setting for saline injection controls and reserpine treated/denervated (see Methods for details) mice. All experiments in this figure were performed using the same U/S settings as in Figs. 2 and 3 (0.83 MPa)
Fig. 5
Fig. 5
Comparison of splenic U/S stimulation versus traditional cervical VNS of CAP. a Relative concentrations of splenic TNF are shown for US-stimulated (left; stimulation at 0.83 MPa) versus implant-based VNS (see Methods for details) treated animals (concentrations are shown as a percent change relative to LPS-treated sham stimulation controls). The first bar on the left of each graph shows the effect of ultrasound versus VNS on attenuation of LPS-induced inflammation without the addition of any blockers or inhibitors. The remaining bars show the effect of pre-injection of the inhibitors PP2 (4-amino-5-(4-chlorophenyl)-7-(dimethylethyl)pyrazolo[3,4-d]pyrimidine, partially selective for Src kinase), LY294002 (PI3-kinase selective), and PD98059 (MEK1- and MEK2-selective MAPK inhibitor). n = 4 for each experimental condition. b Data showing the effect of α-bungarotoxin (BTX) or surgical (cervical) vagotomy on splenic concentrations of (left) norepinephrine (NE) and (right) TNF after US stimulation. n = 4 for each experimental condition. c Data comparing the effect of VNS (at several intensities and frequencies) versus splenic US stimulation (at 0.83 MPa) on heart rate (see Methods). d Data showing specificity in the modulated TNF response for splenic versus liver U/S stimulation, but similar TNF response shown at different splenic stimulation locations (i.e., splenic hilum, superior and inferior pole). n = 3 for each experimental condition. e Data confirming the VNS side-effect on attenuation of LPS-induced hyperglycemia and absence of this side-effect when using splenic U/S stimulation. Relative blood glucose concentrations are shown compared to pre-injection concentration at times of 5, 15, 30, and 60 min for the unstimulated controls (blue-circles), splenic U/S stimulation (purple-triangles), or cervical VNS (light blue-squares). n = 12 for each experimental condition. All experiments in this figure were performed using the same U/S parameters as Figs. 3 and 4
Fig. 6
Fig. 6
Hepatic U/S stimulation of pathways that affect glucose regulation. a 2D US image of the liver used to focus the U/S stimulus to the target site (green arrow; white arrows—outline of the liver). b Data showing the effect of U/S stimulation of the liver on LPS-induced hyperglycemia. Relative blood glucose concentrations compared to pre-injection concentration are shown at times of 5, 15, 30, and 60 min. The data show reversal of LPS-induced hyperglycemia after U/S stimulation of the porta hepatis (red-squares), but not distal lobes (purple-triangles), compared to LPS alone (blue-circles) or naive/no-LPS stimulated (light blue-diamonds) samples c Relative concentrations compared to no U/S for molecules associated with metabolism in the liver and hypothalamus. Significant response to U/S stimulation was found for norepinephrine (NE), protein kinase B (pAkt), insulin receptor substrate 1 (IRS-1), and neuropeptide Y (NPY) in the hypothalamus. The asterisks mark statistical significance using two-sided t-test versus LPS only controls (with p-value thresholds; *p < 0.05, **p < 0.01, ***p < 0.001). n = 12 for each experimental condition. All experiments in this figure were performed using the same U/S parameters as Figs. 3–5
Fig. 7
Fig. 7
Histochemical and DfMRI analysis of neural pathways associated with response to hepatic U/S stimulation. a cFOS immunohistochemistry images showing the number of activated neurons in the (top) unstimulated control and (bottom) U/S-stimulated animals. Images were segmented on the paraventricular nucleus (yellow; PVN), dorsal medial nucleus (green; DMN), ventromedial nucleus (red; VMN), arcuate nucleus (dark blue; ARC), and lateral hypothalamus (purple; LH). Scale bar = 300 microns. b Example MRI overlays between activation maps and the T1 SPGR volume (top; see Methods for details) and a brain atlas overlay on the T1 SPGR volume (bottom; see Methods, Supplementary Figures 13 and 14, and Supplementary Table 2 for further details). The blue color in the top image denotes regions where ADC changed significantly post-U/S. Each color in the bottom image represent anatomically distinct brain regions in the atlas; major areas showing decreased ADC (top image; red arrows) aligned with the left (brown) and right (light green) PVN in the bottom image (red arrows). c Data showing the percent change of the number of cFos expressing cells in the US stimulated animals (n = 8) compared to sham controls (n = 6) in each of the segmented hypothalamic regions (PVN, DMN, VMN, ARC, and LH), images in (a) represent one set of sham versus stimulated paired animals. d T-test values from corresponding-pixel comparison within PVN ROIs (see Methods for details) between the pre- and post-treatment ADC maps showing increased ADC values (compared to controls) for the 6 animals tested after U/S stimulation, images from (b) represent results from one exemplar animal. All experiments in this figure were performed using the same U/S parameters as Figs. 3–6, except the DfMRI experiment in which a MR compatible ultrasound transducer was needed. The compatible ultrasound transducer had an acoustic frequency of 1.47 MHz. The band inside the box shows the second quartile, while the whiskers represent the minimum and maximum of all the data

Comment in

References

    1. Olofsson PS, Tracey KJ. Bioelectronic medicine: technology targeting molecular mechanisms for therapy. J. Intern. Med. 2017;282:3–4. - PMC - PubMed
    1. Birmingham K, et al. Bioelectronic medicines: a research roadmap. Nat. Rev. Drug Discov. 2014;13:399–400. - PubMed
    1. Koopman FA, et al. Vagus nerve stimulation inhibits cytokine production and attenuates disease severity in rheumatoid arthritis. Proc. Natl. Acad. Sci. U.S.A. 2016;113:8284–8289. - PMC - PubMed
    1. Victor RG. Carotid baroreflex activation therapy for resistant hypertension. Nat. Rev. Cardiol. 2015;12:451–463. - PubMed
    1. Meyers EE, Kronemberger A, Lira V, Rahmouni K, Stauss HM. Contrasting effects of afferent and efferent vagal nerve stimulation on insulin secretion and blood glucose regulation. Physiol. Rep. 2016;4:e12718. - PMC - PubMed

Publication types

MeSH terms