. 2019 Mar 12;9(1):4167.
doi: 10.1038/s41598-019-40749-6.

Focus Tracking System for Femtosecond Laser Machining using Low Coherence Interferometry

Affiliations

Focus Tracking System for Femtosecond Laser Machining using Low Coherence Interferometry

Marcus Paulo Raele et al. Sci Rep. .

Abstract

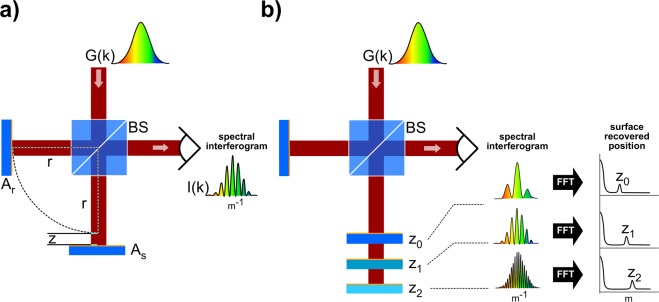
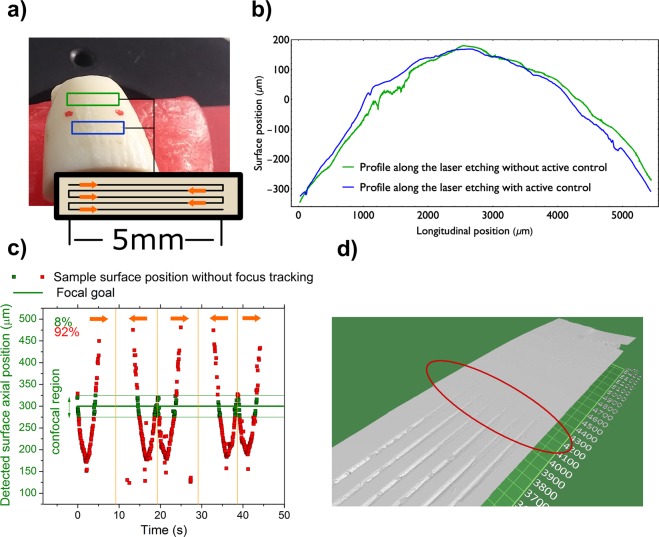
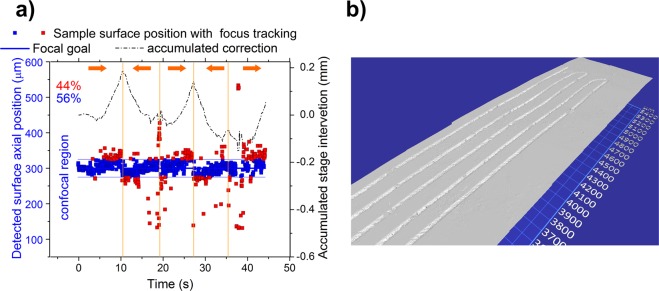
We designed a real time, single-laser focus tracking system using low coherence properties of the machining femtosecond laser itself in order to monitor and correct the sample position relative to the focal plane. Using a Michelson Interferometer, the system collects data arising from part of the beam backscattered at the ablation spot. The data is analyzed by a custom software for position correction (employing an XYZ automated translation stage). With the focus tracking enabled we were able to etch channels with a stable cross-section profile on a bovine tooth with relief amplitude tens of times greater than the Rayleigh length of the system, keeping the sample inside the confocal parameter during most of the processing time. Moreover, the system is also capable of monitoring crater depth evolution during the ablation process, allowing for material removal assessment.


Conflict of interest statement

The authors declare no competing interests.

Figures

Figure 1
Figure 1
(a) LCI setup: a light source, with spectral distribution G(k), is divided by a beam splitter (BS) and part of the beam is directed to a reference arm with reflectivity Ar, while the other part goes to the sample arm with reflectivity As. The arms are set up with an OPD of z. The reflected beams are recombined, producing the spectral distribution I(k), which is analyzed by a spectrometer. (b) Since the intensity is modulated by the OPD, the system can recover the surface position (relative to the Reference known position) through a FFT of the interferometric signal.
Figure 2
Figure 2
(a) The experimental setup: femtosecond laser (FSL) pulses are transmitted through the polarized beam splitter (PBS) and then divided by a 50:50 beam splitter (BS). Part of the FSL radiation is directed to a reference arm after passing a neutral density filter (NDF), and is reflected by the mirror (M2) towards the spectrometer. The other portion of the FSL is focused on the sample’s surface, performing the ablation, and a fraction is backscattered to the BS and spectrometer. The back reflected light also reaches the PBS and, after going through a bandpass filter (BPF), is imaged through a CCD camera for visual inspection. The sample is positioned on a XYZ translation stage. (b) The processing diagram for the system, where a “goal” OPD position - which coincides with the focus of the system - is defined. During machining, the software continuously analyzes the OPD deviation from the “goal”, and decides whether an action on the XYZ translation stage should be carried out.
Figure 3
Figure 3
(a) Bovine tooth sample. The machined regions with and without active focus tracking are highlighted (blue and green boxes, respectively), the raster pattern is illustrated in the black box and the arrows indicate the laser path. (b) Tooth surface profiles showing the curvature along the raster path with (blue) and without (green) focus tracking. There is a total axial displacement of ∼1000 μm for both regions. (c) Surface position (during raster) over time. Square dots represent the detected axial position of the sample surface (relative to the OPD). The surface curvature (axial displacements in the graph) repeats itself over time as the raster goes back and forth. The focal plane (thick solid green line at 300 μm) and its confocal parameter (lighter green lines) are shown for reference. For ease of interpretation, the dots inside confocal parameter are colored green, while those outside (faulty) are red. The vertical orange lines indicate when the raster motion changed direction, which is represented by the orange arrows. (d) Optical profilometry image showing the ceasing of the ablation process after 4000 μm of raster length, shorter than desired.
Figure 4
Figure 4
(a) Surface position over time during the machining with active focus tracking. The position of the axial translation stage, acting to correct the sample position is shown by the dash&dot black line (right Y axis). Square dots represent the detected position of the sample surface; the focal plane and its confocal parameter (solid blue lines, thicker and thinner, respectively) are shown for reference. The dots inside confocal parameter are colored blue, and outside are red. The vertical orange lines indicate when the raster motion changed direction, which is indicated by the orange arrows. (b) Optical profilometry image, showing that machining occurred along the whole raster path.
Figure 5
Figure 5
(a) Transversal profiles of the machined sample, plotted with their absolute position (height), showing the machined grooves’ shapes at the different longitudinal locations, indicated by arrows in (b); the numbers on the gray regions identify each groove. (b) Longitudinal profile of the tooth (parallel to the grooves) with arrows indicating the positions of the profiles show in (a), highlighting a height variation of 500 μm; the curvature of the surface, seen here, explains the positioning of the profiles in (a). (c) Average width (gray) and depth (black) of the five grooves obtained from the 10 measured longitudinal positions, demonstrating a stable machining across grooves.
Figure 6
Figure 6
(a) Optical scattering profile as function of time or FLP (4 kHz rep. rate) for a dual layered metal sample. As machining starts (t0) the system identifies the sample surface and bronze is rapidly etched. The laser, then, reaches the steel layer (t1). The system keeps track of the crater evolution (t2 and t3). (b) An illustration of the process.

Similar articles

Cited by

References

    1. Sugioka, K. & Cheng, Y. Ultrafast lasers-reliable tools for advanced materials processing. Light-Sci. Appl. 3 (2014).
    1. Samad, R. E., Machado, L. M., Vieira Junior, N. D. & de Rossi, W. In Laser pulses - theory, technology, and applications (ed. Prof. Igor Peshko) (InTech, 2012).
    1. Chen, T. H., Fardel, R. & Arnold, C. B. Ultrafast z-scanning for high-efficiency laser micro-machining. Light-Sci. Appl. 7 (2018). - PMC - PubMed
    1. Cao BX, et al. Real-time laser focusing system for high-precision micromachining using diffractive beam sampler and advanced image sensor. Opt. and Las. in Eng. 2018;107:13–20. doi: 10.1016/j.optlaseng.2018.03.002. - DOI
    1. Deck, L. & Degroot, P. High-speed noncontact profiler based on scanning white-light interferometry. Appl. Opt. 33 (1994). - PubMed

Publication types