Clinical Trial
. 2019 Mar 12;9(1):4188.
doi: 10.1038/s41598-019-40786-1.

Integrated analysis of relapsed B-cell precursor Acute Lymphoblastic Leukemia identifies subtype-specific cytokine and metabolic signatures

Affiliations
Clinical Trial

Integrated analysis of relapsed B-cell precursor Acute Lymphoblastic Leukemia identifies subtype-specific cytokine and metabolic signatures

Michael P Schroeder et al. Sci Rep. .

Abstract

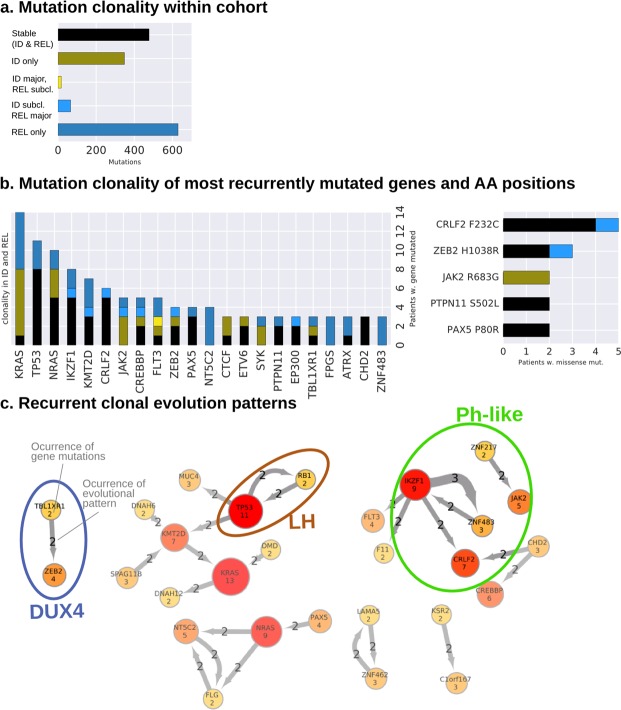
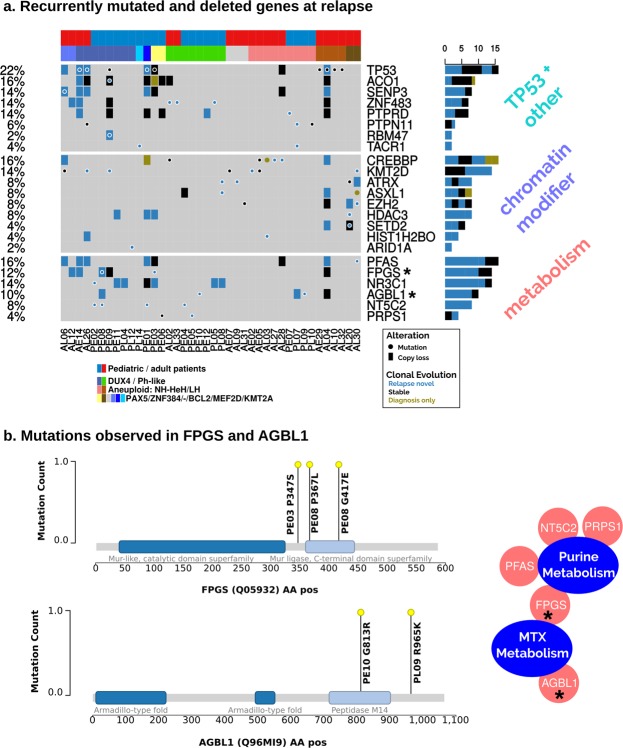
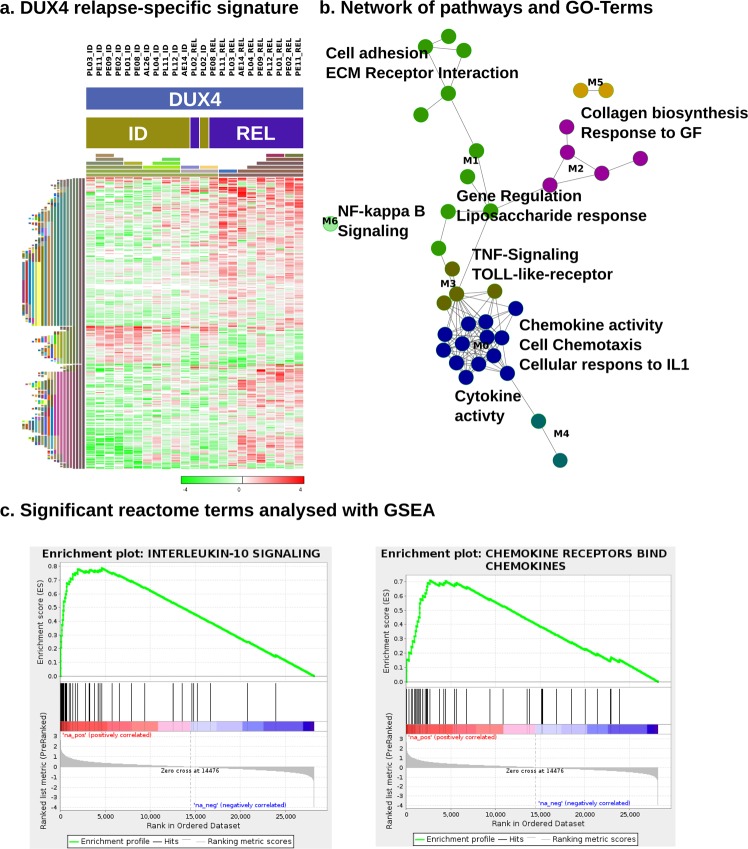
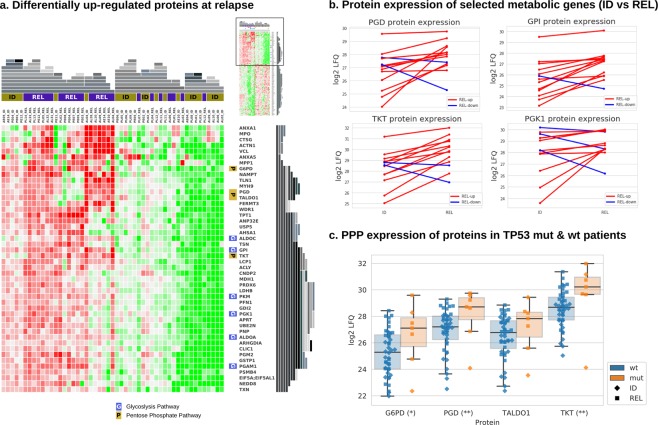
Recent efforts reclassified B-Cell Precursor Acute Lymphoblastic Leukemia (BCP-ALL) into more refined subtypes. Nevertheless, outcomes of relapsed BCP-ALL remain unsatisfactory, particularly in adult patients where the molecular basis of relapse is still poorly understood. To elucidate the evolution of relapse in BCP-ALL, we established a comprehensive multi-omics dataset including DNA-sequencing, RNA-sequencing, DNA methylation array and proteome MASS-spec data from matched diagnosis and relapse samples of BCP-ALL patients (n = 50) including the subtypes DUX4, Ph-like and two aneuploid subtypes. Relapse-specific alterations were enriched for chromatin modifiers, nucleotide and steroid metabolism including the novel candidates FPGS, AGBL and ZNF483. The proteome expression analysis unraveled deregulation of metabolic pathways at relapse including the key proteins G6PD, TKT, GPI and PGD. Moreover, we identified a novel relapse-specific gene signature specific for DUX4 BCP-ALL patients highlighting chemotaxis and cytokine environment as a possible driver event at relapse. This study presents novel insights at distinct molecular levels of relapsed BCP-ALL based on a comprehensive multi-omics integrated data set including a valuable proteomics data set. The relapse specific aberrations reveal metabolic signatures on genomic and proteomic levels in BCP-ALL relapse. Furthermore, the chemokine expression signature in DUX4 relapse underscores the distinct status of DUX4-fusion BCP-ALL.


Conflict of interest statement

The authors declare no competing interests.

Figures

Figure 1
Figure 1
The clonal evolution of BCP-ALL patients reveal volatile and stable gene mutations. (a) The left and middle plot shows the mutation counts (y-axis) categorized into different mutational evolution (x-axis). The bar in black shows the stable mutations that were detected in both ID and REL over 10% variant allele frequency (VAF). The green bar shows mutations, which were only detected in ID and disappeared in REL, followed by the yellow bar, which shows mutations that dropped from over 10% VAF in ID to under 10% VAF in REL. The light blue bar shows the amount of mutations, which were increasing VAF from subclonal levels (under 10%), whereas the last bar reflects the mutations what were only detected in REL over 10% VAF. (b) The mutation count (y-axis) of the most recurrent genes (x-axis) and their categorization of the clonal evolution, maintaining the color scheme from (a). The right-hand plot the same information for recurrent amino acid substitutions by missense mutations with inverted axes. (c) The network shows mutations occurring together in the same and/or in a subsequent clone: the observed mutations (amount in gene nodes) are connected by the arrows. The number in the arrow shows how many times the mutations occurred in the same or a descending clone. Relations between mutations associated exclusively with molecular subgroups are highlighted by the ellipses and labels of the defined subgroups.
Figure 2
Figure 2
Relapse-specific alteration events of the BCP-ALL patients reveal enrichment of metabolism and chromatin modifier genes. (a) Shows relapse-specific mutations and copy number losses. Genes, which had at least one relapse-specific mutation, were selected for their implication in cancer or resistance mechanism. Genes (n = 21) have been classified into three the categories: metabolism, chromatin modifier and TP53 + others. The plot shows that 40 out of 50 (80%) patients have at least one relapse-specific alteration. (b) The relapse-specific missense mutation metabolism-related genes FPGS and AGBL1 are shown in the amino acid sequence. Domains have been obtained from InterPro.
Figure 3
Figure 3
DUX4 relapse-specific gene expression, regulation and pathway analyses reveal a chemokine-driven gene signature. (a) Shows the genes involved in the pathways and GO-terms enriched in REL compared to ID (n = 11; ID n = 12) of the DUX4 subtype that are annotated to an enriched pathway in subfigure (b). The heatmap is clustered by columns and rows (euclidean median hierarchical clustering), represented by the color-coded bars on the left. The expression data show gene-centered fold changes of log2 TPM. (b) Relapse-specific expression signature pathways in the DUX4 subtype. Pathways of interest have been labeled and the edges between the nodes that represent pathways and GO-terms indicate that they share common genes. The FIPlugin for Cytoscape has been used to cluster the network. The resulting clusters are designated by node colors and with labels ranging from M0 to M6. (c) GSEA plots for Reactome pathways IL-10 Signaling and Chemokine Receptors. The strong up-regulation of both of these and other pathways corroborate the results in (a,b).
Figure 4
Figure 4
Proteomics of BCP-ALL relapse. (a) The heatmap shows the proteins that are significantly up-regulated at REL. Proteins of the Phosphate Pentose pathway (PPP) and Glycolysis pathway, both overrepresented pathways at REL, are indicated at the right side of the heatmap by a P or G, respectively. The heatmap has been hierarchically clustered (top and right side representations in grey) using Gitools. (b) Shows expression change of four metabolic proteins at ID and REL. If the net increase in expression is positive, the line is shown in red, otherwise in blue. (c) The box plots show protein expression levels of the members of the PPP as presented in the heatmap in (a), itemized by TP53 wild type (wt; n = 44) and TP53 sequence mutations (mut; n = 7). The significances are represented by the stars next to the protein name as follows: 1 star (*): 0.05 ≥ p > 0.01, 2 stars (**): 0.01 ≥ p > 0.001.

References

    1. Gökbuget N, et al. Outcome of relapsed adult lymphoblastic leukemia depends on response to salvage chemotherapy, prognostic factors, and performance of stem cell transplantation. Blood. 2012;120:2032–2041. doi: 10.1182/blood-2011-12-399287. - DOI - PubMed
    1. Raetz EA, Bhatla T. Where do we stand in the treatment of relapsed acute lymphoblastic leukemia? ASH Educ. Program Book. 2012;2012:129–136. - PubMed
    1. Krentz S, et al. Prognostic value of genetic alterations in children with first bone marrow relapse of childhood B-cell precursor acute lymphoblastic leukemia. Leukemia. 2013;27:295–304. doi: 10.1038/leu.2012.155. - DOI - PubMed
    1. Pikman, Y. & Stegmaier, K. Targeted therapy for fusion-driven high-risk acute leukemia. Blood blood–2018–04–784157, 10.1182/blood-2018-04-784157 (2018). - PMC - PubMed
    1. Lengline E, et al. Successful tyrosine kinase inhibitor therapy in a refractory B-cell precursor acute lymphoblastic leukemia with EBF1-PDGFRB fusion. Haematologica. 2013;98:e146–e148. doi: 10.3324/haematol.2013.095372. - DOI - PMC - PubMed

Publication types