. 2019 Mar 12;9(1):4179.
doi: 10.1038/s41598-019-39627-y.

Pivotal role of inter-organ aspartate metabolism for treatment of mitochondrial aspartate-glutamate carrier 2 (citrin) deficiency, based on the mouse model

Affiliations

Pivotal role of inter-organ aspartate metabolism for treatment of mitochondrial aspartate-glutamate carrier 2 (citrin) deficiency, based on the mouse model

Takeyori Saheki et al. Sci Rep. .

Abstract

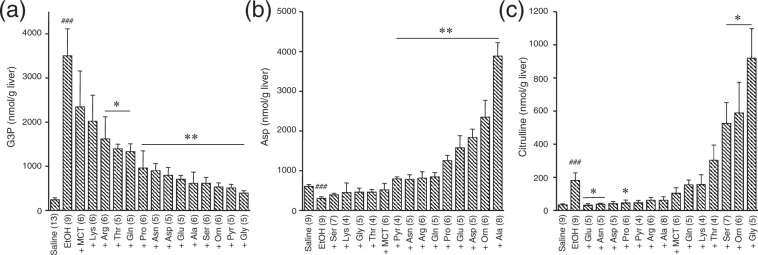
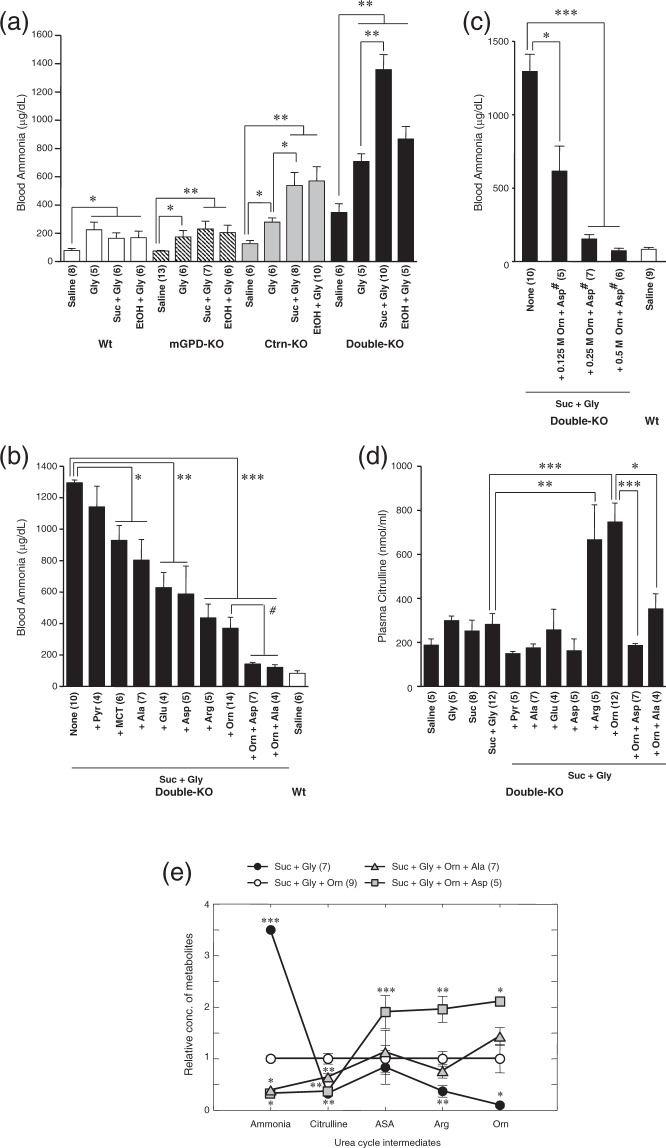
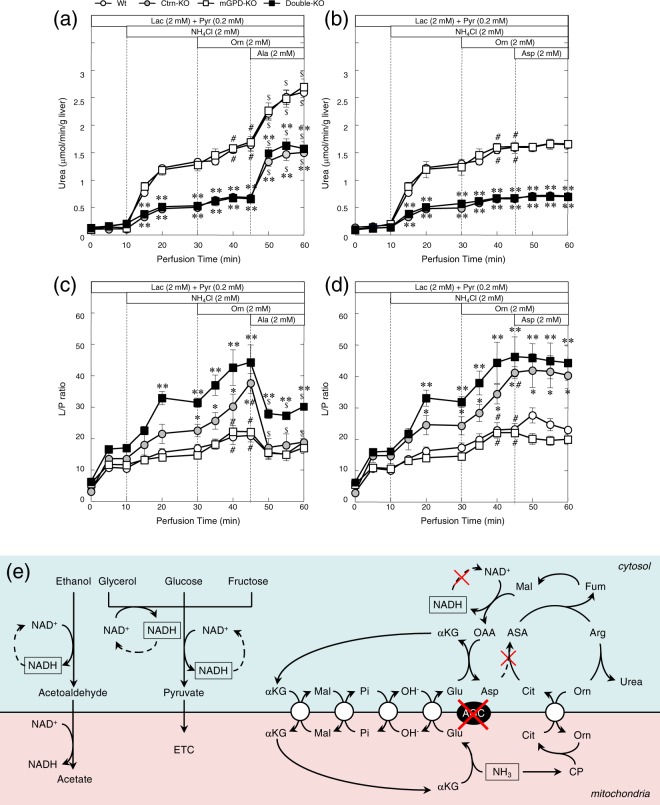
Previous studies using citrin/mitochondrial glycerol-3-phosphate (G3P) dehydrogenase (mGPD) double-knockout mice have demonstrated that increased dietary protein reduces the extent of carbohydrate-induced hyperammonemia observed in these mice. This study aimed to further elucidate the mechanisms of this effect. Specific amino acids were initially found to decrease hepatic G3P, or increase aspartate or citrulline levels, in mGPD-knockout mice administered ethanol. Unexpectedly, oral glycine increased ammonia in addition to lowering G3P and increasing citrulline. Subsequently, simultaneous glycine-plus-sucrose (Gly + Suc) administration led to a more severe hyperammonemic state in double-KO mice compared to sucrose alone. Oral arginine, ornithine, aspartate, alanine, glutamate and medium-chain triglycerides all lowered blood ammonia following Gly + Suc administration, with combinations of ornithine-plus-aspartate (Orn + Asp) or ornithine-plus-alanine (Orn + Ala) suppressing levels similar to wild-type. Liver perfusion and portal vein-arterial amino acid differences suggest that oral aspartate, similar to alanine, likely activated ureagenesis from ammonia and lowered the cytosolic NADH/NAD+ ratio through conversion to alanine in the small intestine. In conclusion, Gly + Suc administration induces a more severe hyperammonemic state in double-KO mice that Orn + Asp or Orn + Ala both effectively suppress. Aspartate-to-alanine conversion in the small intestine allows for effective oral administration of either, demonstrating a pivotal role of inter-organ aspartate metabolism for the treatment of citrin deficiency.


Conflict of interest statement

The authors declare no competing interests.

Figures

Figure 1
Figure 1
Effects of amino acid supplementation on hepatic glycerol 3-phosphate (G3P; panel (a)), aspartate (Asp; panel (b)), and citrulline (c) levels in mGPD-KO mice administered 5% ethanol. Amino acid solutions (1 M; with the exception of glutamine and asparagine at 0.5 M) was enterally administered with 5% ethanol (20 ml/kg bw), and the liver was removed by freeze-cramp procedure 1 h after administration. Data are expressed as mean ± SEM. Asterisks (*P < 0.05, and **P < 0.01) denote statistical differences compared to the levels following administered ethanol alone; ###P < 0.001, statistical difference between saline and ethanol administered groups.
Figure 2
Figure 2
Effects of oral supplementation indicated on blood ammonia (panels (a), (b) and (c)) and plasma citrulline (d), and cross-over point analysis of urea cycle intermediates (e). (a) Effects of 1 M Gly administered with or without 20% sucrose (Suc) or 5% ethanol (EtOH) (20 ml/kg bw) on blood ammonia in all four mouse genotypes: wild type (wt; white bar), mGPD-KO (hatched bar), Ctrn-KO (gray bar) and Ctrn/mGPD double-KO (black bar). (b) Effects of 0.5 M amino acids (Ala, Glu, Asp, Arg or Orn; 10 mmol/kg bw), 0.5 M Pyr (10 mmol/kg bw), 5% MCT (1 g/kg bw) or combination of amino acids (each 10 mmol/kg bw) on blood ammonia levels increased by administration of 20% Suc + 1 M Gly (total 20 ml/kg bw) in double-KO mice, with wt mice administered saline as a reference level. (c) Dose response of Orn plus Asp (Orn + Asp#; L-aspartate salt of L-ornithine was used) on blood ammonia. The concentrations of Orn + Asp# were 0.125 M (2.5 mmol/kg bw), 0.25 M (5 mmol/kg bw) or 0.5 M (10 mmol/kg bw), and administered with 20% Suc + 1 M Gly. (d) Effects of administration of amino acids and other substances indicated in the figure on plasma citrulline in Ctrn/mGPD double-KO mice. (e) Each of hepatic or blood metabolite concentrations under Suc + Gly + Orn was set at 1 and the metabolite concentrations under the other conditions were calculated and plotted. The concentration of blood ammonia was used as Ammonia in the figure. Data are expressed as mean ± SEM. Asterisks (*P < 0.05, **P < 0.01, and ***P < 0.001) denote statistical differences between indicated groups by an unpaired t-test (panels (a), (b), (c) and (d)). Asterisks (*P < 0.05, **P < 0.01, and ***P < 0.001) denote statistical differences from the baseline of Suc + Gly + Orn.
Figure 3
Figure 3
Effect of Ala (panels (a) and (c)) and Asp (panels (b) and (d)) on ureagenesis (panels (a) and (b)), and changes in lactate-to-pyruvate (L/P ratio; panels (c) and (d)) in perfused liver from wt (white circle), mGPD-KO (white square), Ctrn-KO (gray circle) and Ctrn/mGPD double-KO (black square) mice. (e) Schematic diagram of ureagenesis pathway from ammonia without citrin (AGC2) in relation to mitochondria and sugar and ethanol metabolism. The results are expressed as means ± SEM for 5-6 independent experiments. *P < 0.05, and **P < 0.01 denote statistical differences from wt mice. #P < 0.05 and $P < 0.05 denote statistical differences from the level at perfusion time 30 and 45 within the same genotypes, respectively. Abbreviations used are, αKG, α-ketoglutarate; ASA, argininosuccinate; Cit, citrulline; CP, carbamoylphosphate; ETC, electron transport chain; Fum, fumarate; OAA, oxaloacetate; Mal, malate; Pi, inorganic phosphate.
Figure 4
Figure 4
Portal vein-arterial differences in the plasma concentration of Gln, Ala, Cit and Pro 1 hr after administration of saline, Asp, Glu, Orn or Gly (a), schematic diagram of Asp metabolism after enteral administration within the small intestine and liver (b), and postulated metabolic pathway of Ala in periportal hepatocytes (c). Asp, Glu, Orn or Gly (20 ml/kg bw; 10 mmol/kg bw) were enterally administered to mGPD-KO mice, and 1 hr after the administration, blood was collected simultaneously from portal vein and abdominal aorta for the portal vein-arterial difference. Minus and plus values denote uptake by, and release from, the portal vein, respectively. Number of mice are shown in parentheses. *P < 0.05 and **P < 0.01 denote differences compared to saline.

References

    1. Saheki, T. & Song, Y. Z. Citrin deficiency, In: Adam, M. P. et al. editors. GeneReviews® [Internet]. Seattle (WA): University of Washington, Seattle; 1993-2017. 2005 Sep 16 [updated 2017 Aug 10]. - PubMed
    1. Kobayashi K, et al. The gene mutated in adult-onset type II citrullinaemia encodes a putative mitochondrial carrier protein. Nat. Genet. 1999;22:159–163. doi: 10.1038/9667. - DOI - PubMed
    1. Palmieri L, et al. Citrin and aralar1 are Ca2+-stimulated aspartate/glutamate transporters in mitochondria. EMBO J. 2001;20:5060–5069. doi: 10.1093/emboj/20.18.5060. - DOI - PMC - PubMed
    1. Saheki T, et al. Reduced carbohydrate intake in citrin-deficient subjects. J. Inherit. Metab. Dis. 2008;31:386–394. doi: 10.1007/s10545-008-0752-x. - DOI - PubMed
    1. Nakamura M, et al. The characteristics of food intake in patients with type II citrullinemia. J. Nutr. Sci. Vitaminol. 2011;57:239–245. doi: 10.3177/jnsv.57.239. - DOI - PubMed

Publication types

MeSH terms

Supplementary concepts