. 2019 Feb 26:13:56.
doi: 10.3389/fnhum.2019.00056. eCollection 2019.

EEG Microstates Temporal Dynamics Differentiate Individuals with Mood and Anxiety Disorders From Healthy Subjects

Collaborators, Affiliations

EEG Microstates Temporal Dynamics Differentiate Individuals with Mood and Anxiety Disorders From Healthy Subjects

Obada Al Zoubi et al. Front Hum Neurosci. .

Abstract

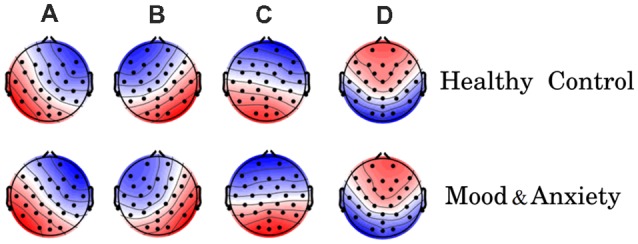
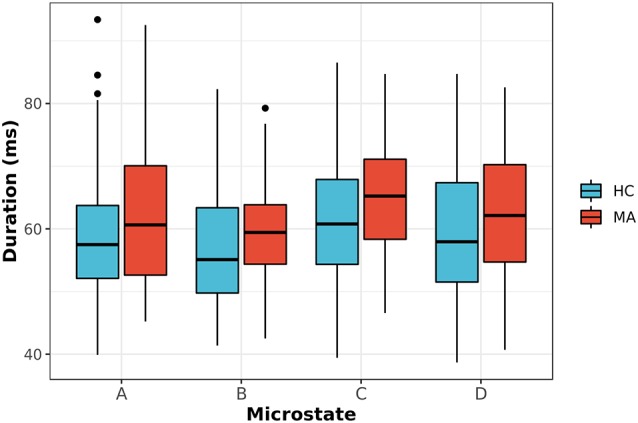
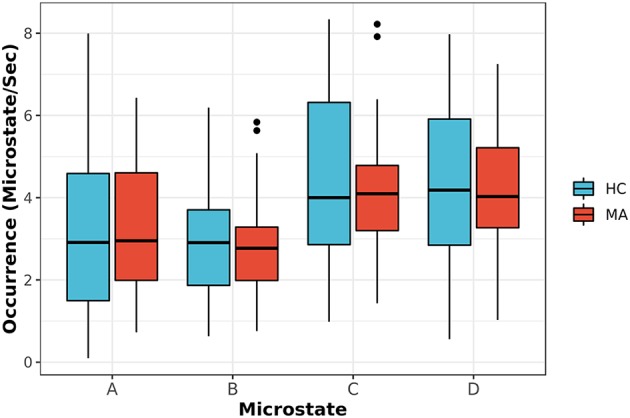
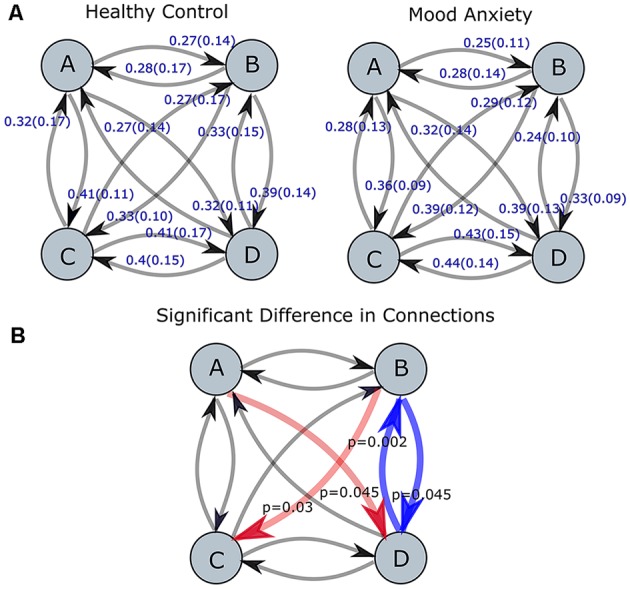
Electroencephalography (EEG) measures the brain's electrophysiological spatio-temporal activities with high temporal resolution. Multichannel and broadband analysis of EEG signals is referred to as EEG microstates (EEG-ms) and can characterize such dynamic neuronal activity. EEG-ms have gained much attention due to the increasing evidence of their association with mental activities and large-scale brain networks identified by functional magnetic resonance imaging (fMRI). Spatially independent EEG-ms are quasi-stationary topographies (e.g., stable, lasting a few dozen milliseconds) typically classified into four canonical classes (microstates A through D). They can be identified by clustering EEG signals around EEG global field power (GFP) maxima points. We examined the EEG-ms properties and the dynamics of cohorts of mood and anxiety (MA) disorders subjects (n = 61) and healthy controls (HCs; n = 52). In both groups, we found four distinct classes of EEG-ms (A through D), which did not differ among cohorts. This suggests a lack of significant structural cortical abnormalities among cohorts, which would otherwise affect the EEG-ms topographies. However, both cohorts' brain network dynamics significantly varied, as reflected in EEG-ms properties. Compared to HC, the MA cohort features a lower transition probability between EEG-ms B and D and higher transition probability from A to D and from B to C, with a trend towards significance in the average duration of microstate C. Furthermore, we harnessed a recently introduced theoretical approach to analyze the temporal dependencies in EEG-ms. The results revealed that the transition matrices of MA group exhibit higher symmetrical and stationarity properties as compared to HC ones. In addition, we found an elevation in the temporal dependencies among microstates, especially in microstate B for the MA group. The determined alteration in EEG-ms temporal dependencies among the cohorts suggests that brain abnormalities in mood and anxiety disorders reflect aberrant neural dynamics and a temporal dwelling among ceratin brain states (i.e., mood and anxiety disorders subjects have a less dynamicity in switching between different brain states).

Keywords: EEG microstate; brain; mood and anxiety disorders; temporal dynamic; transition probabilites.


Figures

Figure 1
Figure 1
Electroencephalography-microstate (EEG-ms) topographies for both groups [healthy control (HC) group top row, mood and anxiety disorders (MA) group lower row]. The obtained EEG-ms topologies are similar to those reported previously in the literature.
Figure 2
Figure 2
The average duration for EEG-ms classes (A–D) for MA and HC groups (p-value corrected for multiple comparisons using the Bonferroni-Holm). The results revealed a trend towards significance for microstate C with p = 0.092.
Figure 3
Figure 3
The occurrence frequency of EEG-ms classes (A–D) for both MA and HC groups. For each EEG-ms class, no statistically significant differences among the two groups was found.
Figure 4
Figure 4
Transition probabilities for MA and HC groups are shown in part (A). The red and blue arrows (red represent an increase, while blue represent a decrease for MA group as compared to HC one) in part (B) represent the connections with the statistically significant difference between two groups (p-values corrected for multiple comparisons using Bonferroni-Holm). The level of significance was set to p < 0.05.
Figure 5
Figure 5
The ratio of subjects with non-stationary transition matrices (p < 0.05) of EEG-ms evaluated at different block lengths.
Figure 6
Figure 6
The semi-log time-lagged mutual information plot for the MA and HC groups at different time lags. The shaded area represents the 95% confidence intervals for each group.
Figure 7
Figure 7
Time-lagged mutual information plots for each class of EEG microstate averaged across subjects of each group. The shaded area represents the 95% confidence for each group.

References

    1. Aldao A., Nolen-Hoeksema S. (2010). Specificity of cognitive emotion regulation strategies: a transdiagnostic examination. Behav. Res. Ther. 48, 974–983. 10.1016/j.brat.2010.06.002 - DOI - PubMed
    1. Allen P. J., Josephs O., Turner R. (2000). A method for removing imaging artifact from continuous EEG recorded during functional MRI. Neuroimage 12, 230–239. 10.1006/nimg.2000.0599 - DOI - PubMed
    1. Allen P. J., Polizzi G., Krakow K., Fish D. R., Lemieux L. (1998). Identification of EEG events in the MR scanner: the problem of pulse artifact and a method for its subtraction. Neuroimage 8, 229–239. 10.1006/nimg.1998.0361 - DOI - PubMed
    1. Allen J. J., Reznik S. J. (2015). Frontal EEG asymmetry as a promising marker of depression vulnerability: summary and methodological considerations. Curr. Opin. Psychol. 4, 93–97. 10.1016/j.copsyc.2014.12.017 - DOI - PMC - PubMed
    1. Andreou C., Faber P. L., Leicht G., Schoettle D., Polomac N., Hanganu-Opatz I. L., et al. . (2014). Resting-state connectivity in the prodromal phase of schizophrenia: insights from EEG microstates. Schizophr. Res. 152, 513–520. 10.1016/j.schres.2013.12.008 - DOI - PubMed

LinkOut - more resources