. 2019 Feb 26:13:62.
doi: 10.3389/fnhum.2019.00062. eCollection 2019.

Predicting Brain Age Based on Spatial and Temporal Features of Human Brain Functional Networks

Affiliations

Predicting Brain Age Based on Spatial and Temporal Features of Human Brain Functional Networks

Jian Zhai et al. Front Hum Neurosci. .

Abstract

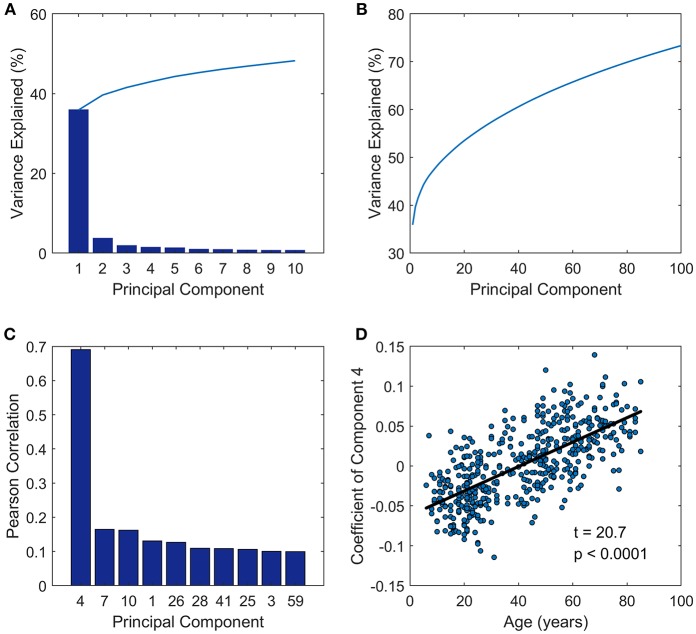
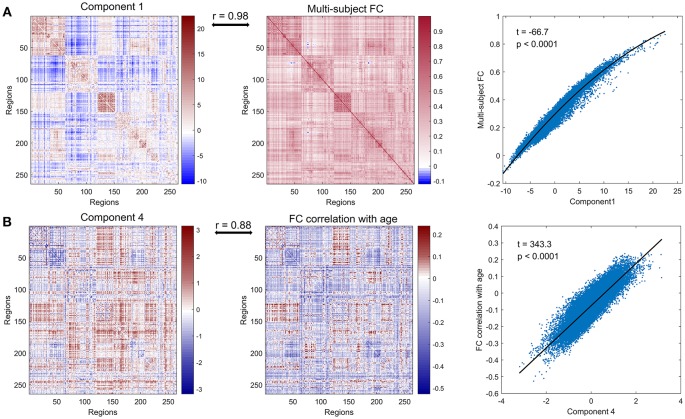
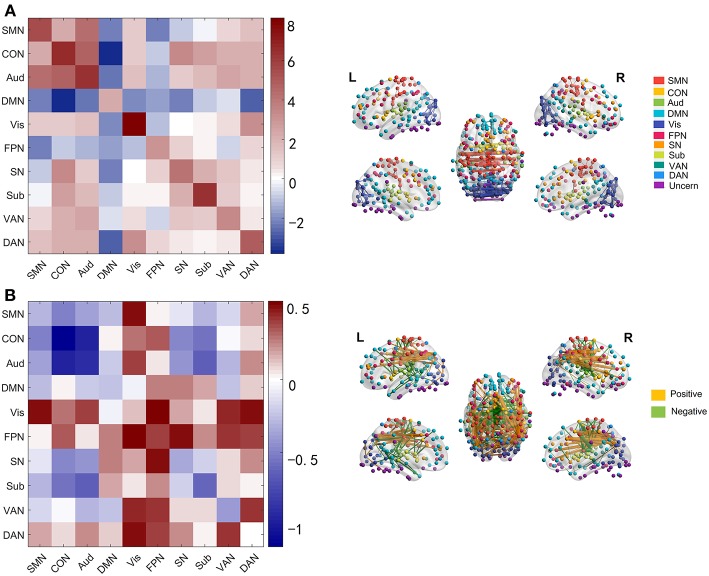
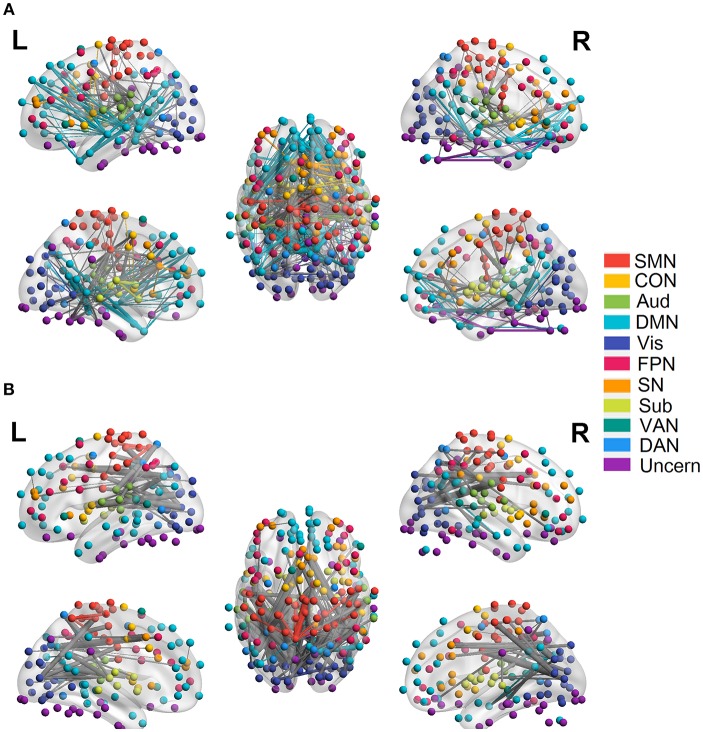
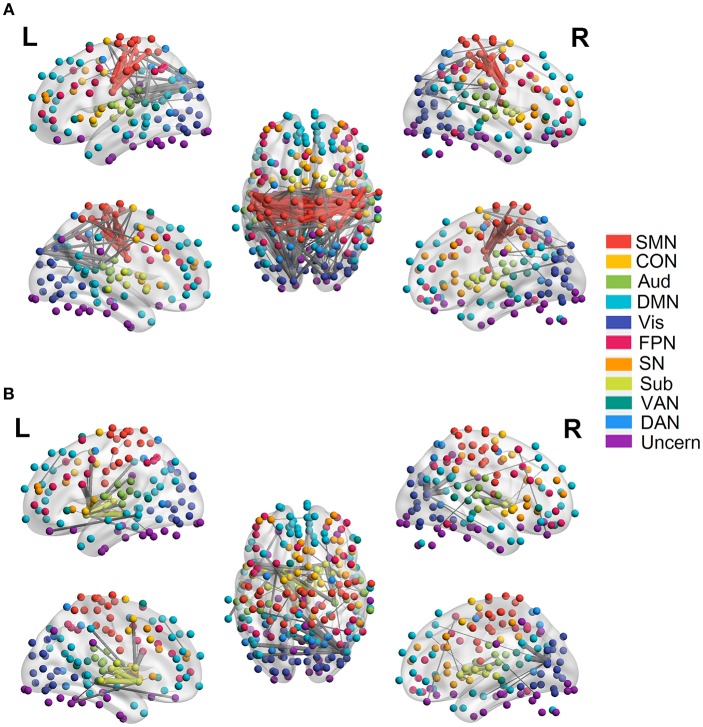
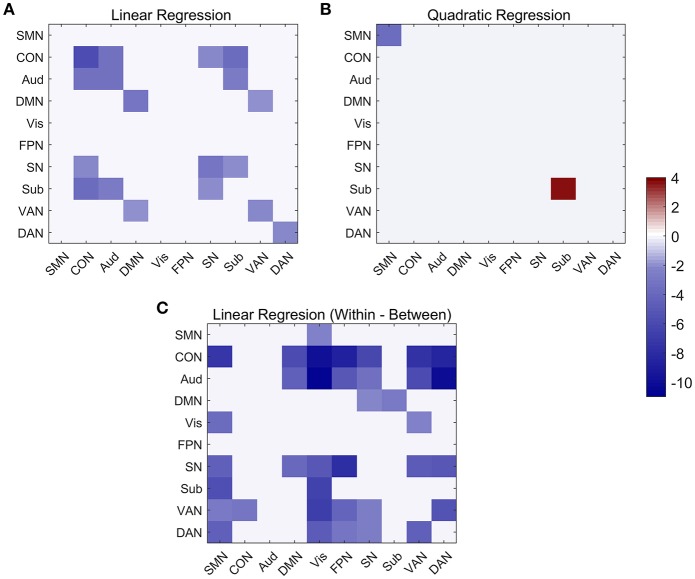
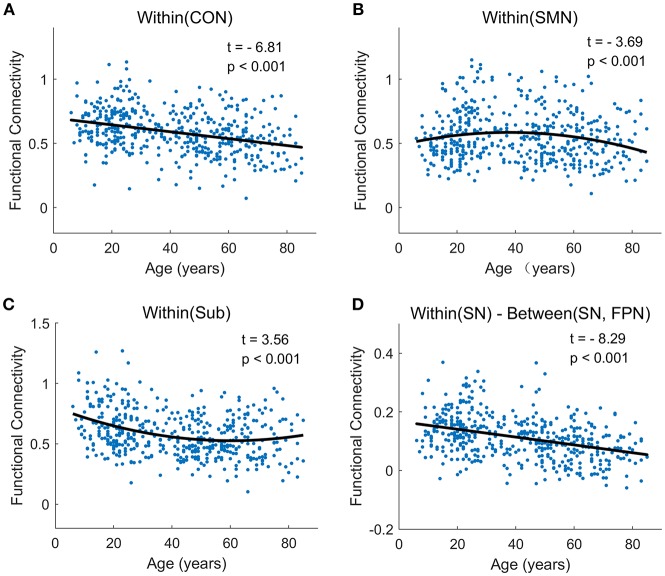
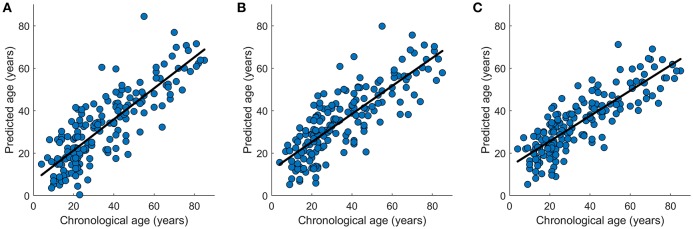
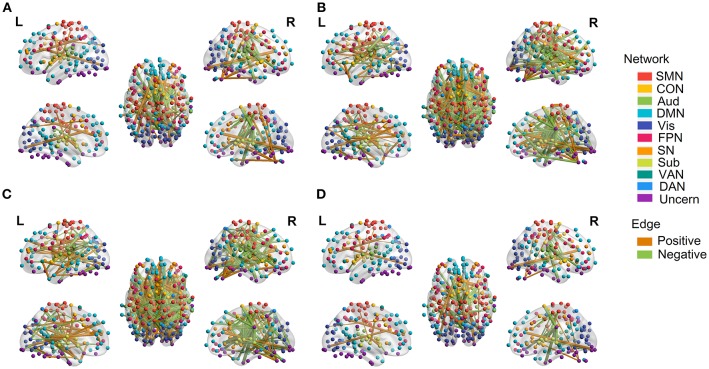
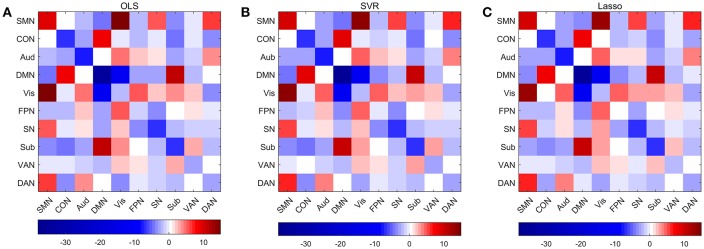
The organization of human brain networks can be measured by capturing correlated brain activity with functional MRI data. There have been a variety of studies showing that human functional connectivities undergo an age-related change over development. In the present study, we employed resting-state functional MRI data to construct functional network models. Principal component analysis was performed on the FC matrices across all the subjects to explore meaningful components especially correlated with age. Coefficients across the components, edge features after a newly proposed feature reduction method as well as temporal features based on fALFF, were extracted as predictor variables and three different regression models were learned to make prediction of brain age. We observed that individual's functional network architecture was shaped by intrinsic component, age-related component and other components and the predictive models extracted sufficient information to provide comparatively accurate predictions of brain age.

Keywords: fMRI; functional connectivity; lifespan; predictive model; principal component; resting state.


Figures

Figure 1
Figure 1
Principal component analysis results. (A) Variance explained by the first 10 components. (B) Variance explained by the first 100 components. (C) The first ten components which were most closely correlated with age. (D) The coefficients of PC 4 across subjects (y-axis) vs. ages of subjects (x-axis) fitted by a linear regression model.
Figure 2
Figure 2
Further analysis of principal component 1 and principal component 4. (A) PC 1 (left panel), multi-subject matrix by calculating correlations across the concatenated time series of all subjects (middle panel) and the quadratic association between values of PC 1 (x-axis) and values of multi-subject matrix (y-axis) (right panel). PC 1 and multi-subject matrix are highly correlated (r = 0.98). (B) PC 4 (left panel), the matrix of age effects on edges by computing the correlation between age and functional connectivity for each edge (middle panel) and the linear association between values of PC 4 (x-axis) and values of age-effect matrix (y-axis) (right panel). PC 4 and age-effect matrix are highly correlated (r = 0.88).
Figure 3
Figure 3
Networks and edges in PC 1 and PC 4. (A) Mean value of edges within and between networks in PC 1(left panel), and edges with absolute value higher than 12 in PC 1 (right panel) which are chosen for convenient viewing. (B) Mean value of edges within and between networks in PC 4 (left panel), and edges with absolute value higher than 1.8 in PC 4 (right panel).
Figure 4
Figure 4
Linear relationship between functional connectivity and age at the edge level (p < 0.0001, FDR corrected). (A) Significant edges linearly decreasing with age. (B) Significant edges linearly increasing with age. Different color refers to different networks. If two nodes of the edge have same color, that is, they belong to the same network, the edge will be set as the same color. Otherwise the edge will be colored gray. The edge size is scaled by its T-statistics.
Figure 5
Figure 5
Quadratic relationship between functional connectivity and age at the edge level (p < 0.0001, FDR corrected). (A) Significant edges showing negative quadratic changes with age. (B) Significant edges showing positive quadratic changes with age. Different color refers to different networks. If two nodes of the edge have same color, that is, they belong to the same network, the edge will be set as the same color. Otherwise the edge will be colored gray. The edge size is scaled by its T-statistics.
Figure 6
Figure 6
Linear and quadratic relationship between functional connectivity and age at the network-average level. (A) Significant networks showing linear changes with age in both within and between network connectivity. (B) Significant networks showing quadratic changes with age in both within-network and between-network connectivity. (C) Significant networks showing linear changes with age in within-between network connectivity.
Figure 7
Figure 7
The typically developmental trajectories of functional connectivity at the network-average level. (A) Linear decrease with age in Within (CON) connectivity. (B) Negative quadratic change with age in Within (SMN) connectivity. (C) Positive quadratic change with age in Within (Sub) connectivity. (D) Linear decrease with age in Within (SN)-Between (SN, FPN) connectivity. The curve fits are shown by the dark lines.
Figure 8
Figure 8
Graphical representation of the age prediction results. (A) Chronological age (x-axis) vs. predicted age (y-axis) acquired by OLS regression model. (B) Chronological age (x-axis) vs. predicted age (y-axis) acquired by SVR regression model. (C) Chronological age (x-axis) vs. predicted age (y-axis) acquired by Lasso regression model. The curve fits are shown by the dark lines.
Figure 9
Figure 9
Edges with significant weights in predictive models combining three regression models with edge-based feature selection method. (A) Edges with significant weights in OLS regression model. (B) Edges with significant weights in SVR regression model. (C) Edges with significant weights in Lasso regression model. (D) Common edges with significant weights in all three models. Edges with positive significant weights are shown in orange, whereas edges with negative weights are shown in green.
Figure 10
Figure 10
Average weights of edges within and between networks in predictive models combining three regression models with edge-based feature selection method. (A) Average weights within and between networks in OLS model. (B) Average weights within and between networks in SVR model. (C) Average weights within and between networks in Lasso model.

References

    1. Andrews-Hanna J. R. (2012). The brain's default network and its adaptive role in internal mentation. Neuroscientist 18, 251–270. 10.1177/1073858411403316 - DOI - PMC - PubMed
    1. Ashburner J. (2007). A fast diffeomorphic image registration algorithm. Neuroimage 38, 95–113. 10.1016/j.neuroimage.2007.07.007 - DOI - PubMed
    1. Ashburner J., Friston K. J. (2005). Unified segmentation. Neuroimage 26, 839–851. 10.1016/j.neuroimage.2005.02.018 - DOI - PubMed
    1. Bassett D. S., Sporns O. (2017). Network neuroscience. Nat. Neurosci. 20, 353–364. 10.1038/nn.4502 - DOI - PMC - PubMed
    1. Battaglia D., Thomas B., Hansen E. C., Chettouf S., Daffertshofer A., McIntosh A. R., et al. (2017). Functional connectivity dynamics of the resting state across the human adult lifespan. bioRxiv 107243 10.1101/107243 - DOI

LinkOut - more resources