

Transcriptome Analysis Reveals Common and Differential Response to Low Temperature Exposure Between Tolerant and Sensitive Blue Tilapia (Oreochromis aureus)
- PMID: 30863423
- PMCID: PMC6399464
- DOI: 10.3389/fgene.2019.00100
Transcriptome Analysis Reveals Common and Differential Response to Low Temperature Exposure Between Tolerant and Sensitive Blue Tilapia (Oreochromis aureus)
Abstract
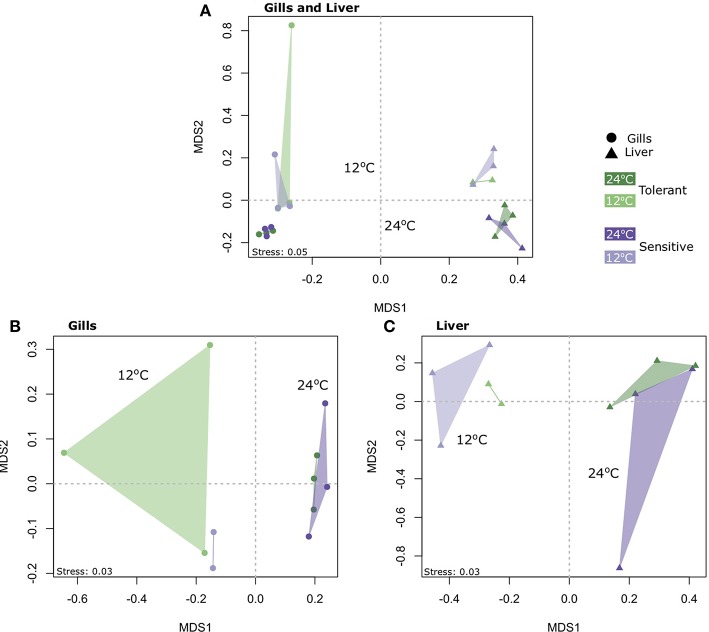
Tilapias are very important to the world's aquaculture. As befitting fish of their tropical origin, their distribution, and culture practices are highly affected by low temperatures. In this study, we used genetic and genomic methodologies to reveal pathways involved in the response and tolerance of blue tilapia (Oreochromis aureus) to low temperature stress. Cold tolerance was characterized in 66 families of blue tilapia. Fish from cold-tolerant and cold-sensitive families were sampled at 24 and 12°C, and the transcriptional responses to low-temperature exposure were measured in the gills and liver by high-throughput mRNA sequencing. Four hundred and ninety four genes displayed a similar temperature-dependent expression in both tolerant and sensitive fish and in the two tissues, representing the core molecular response to low temperature exposure. KEGG pathway analysis of these genes revealed down-regulation of focal-adhesion and other cell-extracellular matrix (ECM) interactions, and up-regulation of proteasome and various intra-cellular proteolytic activities. Differential responses between cold-tolerant and cold-sensitive fish were found with genes and pathways that were up-regulated in one group and down-regulated in the other. This reverse response was characterized by genes involved in metabolic pathways such as glycolysis/gluconeogenesis in the gills and biosynthesis of amino-acids in the liver, with low temperature down-regulation in tolerant fish and up-regulation in sensitive fish.
Keywords: Oreochromis; carbon metabolism; cold tolerance; selective breeding; tilapia; transcriptome.
Figures


Similar articles
-
Identification of Genes Related to Cold Tolerance and Novel Genetic Markers for Molecular Breeding in Taiwan Tilapia (Oreochromis spp.) via Transcriptome Analysis.Animals (Basel). 2021 Dec 13;11(12):3538. doi: 10.3390/ani11123538. Animals (Basel). 2021. PMID: 34944312 Free PMC article.
-
Establishment and characterization of a cold-sensitive neural cell line from the brain of tilapia (Oreochromis niloticus).J Fish Biol. 2021 Mar;98(3):842-854. doi: 10.1111/jfb.14637. Epub 2020 Dec 16. J Fish Biol. 2021. PMID: 33258111
-
Comparative analysis of quantitative phosphoproteomics between two tilapias (Oreochromis niloticus and Oreochromis aureus) under low-temperature stress.PeerJ. 2023 Jul 10;11:e15599. doi: 10.7717/peerj.15599. eCollection 2023. PeerJ. 2023. PMID: 37456864 Free PMC article.
-
Differential gene expression profiling through transcriptome approach of Saccharum spontaneum L. under low temperature stress reveals genes potentially involved in cold acclimation.3 Biotech. 2018 Apr;8(4):195. doi: 10.1007/s13205-018-1194-2. Epub 2018 Mar 23. 3 Biotech. 2018. PMID: 29581927 Free PMC article.
-
Molecular mechanisms involved in postharvest chilling tolerance of pomegranate fruit.J Sci Food Agric. 2019 Oct;99(13):5617-5623. doi: 10.1002/jsfa.9933. Epub 2019 Aug 12. J Sci Food Agric. 2019. PMID: 31321784 Review.
Cited by
-
Effects of cold stress on the blood-brain barrier in Plectropomus leopardus.BMC Genomics. 2024 Nov 4;25(1):1031. doi: 10.1186/s12864-024-10943-6. BMC Genomics. 2024. PMID: 39497085 Free PMC article.
-
Integration of Transcriptomics and Proteomics Analysis Reveals the Molecular Mechanism of Eriocheir sinensis Gills Exposed to Heat Stress.Antioxidants (Basel). 2023 Nov 21;12(12):2020. doi: 10.3390/antiox12122020. Antioxidants (Basel). 2023. PMID: 38136140 Free PMC article.
-
Gene Expression Profile and Co-Expression Network of Pearl Gentian Grouper under Cold Stress by Integrating Illumina and PacBio Sequences.Animals (Basel). 2021 Jun 11;11(6):1745. doi: 10.3390/ani11061745. Animals (Basel). 2021. PMID: 34208015 Free PMC article.
-
Comparative Transcriptome Analysis of Gill Tissue in Response to Hypoxia in Silver Sillago (Sillago sihama).Animals (Basel). 2020 Apr 6;10(4):628. doi: 10.3390/ani10040628. Animals (Basel). 2020. PMID: 32268576 Free PMC article.
-
MicroRNA qPCR normalization in Nile tilapia (Oreochromis niloticus): Effects of acute cold stress on potential reference targets.Fish Physiol Biochem. 2023 Jun;49(3):409-423. doi: 10.1007/s10695-023-01190-9. Epub 2023 Apr 19. Fish Physiol Biochem. 2023. PMID: 37074474
References
-
- Anderson M. J. (2001). A new method for non-parametric multivariate analysis of variance. Austral Ecol. 26, 32–46. 10.1111/j.1442-9993.2001.01070.pp.x - DOI
-
- Charo-Karisa H., Rezk M. A., Bovenhuis H., Komen H. (2005). Heritability of cold tolerance in Nile tilapia, Oreochromis niloticus, juveniles. Aquaculture 249, 115–123. 10.1016/j.aquaculture.2005.04.029 - DOI
-
- Cnaani A., Gall G. A. E., Hulata G. (2000). Cold tolerance of tilapia species and hybrids. Aquac. Int. 8, 289–298. 10.1023/A:1009299109614 - DOI
-
- Cnaani A., Hallerman E. M., Ron M., Weller J. I., Indelman M., Kashi Y., et al. (2003). Detection of a chromosomal region with two quantitative trait loci, affecting cold tolerance and fish size, in an F2 tilapia hybrid. Aquaculture 223, 117–128. 10.1016/S0044-8486(03)00163-7 - DOI
LinkOut - more resources
Full Text Sources
Other Literature Sources
Research Materials