. 2019 Feb 4:2019:4862760.
doi: 10.1155/2019/4862760. eCollection 2019.

Intermittent Hypoxia Composite Abnormal Glucose Metabolism-Mediated Atherosclerosis In Vitro and In Vivo: The Role of SREBP-1

Affiliations

Intermittent Hypoxia Composite Abnormal Glucose Metabolism-Mediated Atherosclerosis In Vitro and In Vivo: The Role of SREBP-1

Linqin Ma et al. Oxid Med Cell Longev. .

Abstract

Objective: The aim of this study was to establish a 3T3-L1 adipocyte model and ApoE-/- mouse model of intermittent hypoxia (IH) composite abnormal glucose metabolism (AGM) in vitro and in vivo and explore their synergistic damage effect leading to atherosclerosis (AS) and the influence of SREBP-1 signaling molecule-related mechanisms.

Methods: Mature 3T3-L1 adipocytes were cultured with complete culture medium containing DEX 1 × 10⁶ mol/L for 96 h to establish an AGM-3T3-L1 adipocyte model. Then, AGM-3T3-L1 adipocytes were treated with IH for 0 cycles, 2 cycles, 4 cycles, 8 cycles, 16 cycles, and 32 cycles and sustained hypoxia (SH). ApoE-/- mice were treated with high-fat diet and injection of STZ solution to establish an AGM-ApoE-/- mouse model. A total of 16 AGM-ApoE-/- mice were randomly and averagely divided into the normoxic control group (NC) and model group (CIH). AGM-ApoE-/- mice of the CIH group were treated with IH, which meant that the oxygen concentration fell to 10 ± 0.5% in the first 90 seconds of one cycle and then increased to 21 ± 0.5% in the later 90 seconds, continuous for eight hours per day (09 : 00-17 : 00) with a total of eight weeks. Eight C57BL/6J mice were used as the blank control group (Con) which was fed with conventional diet. qPCR and Western blotting were used to detect the expression level of SREBP-1c, FAS, and IRS-1. Oil Red O staining was used to compare the plaque of the aorta among each mouse group.

Results: As a result, within 32 cycles of IH, mRNA and protein expression levels of SREBP-1c and FAS in AGM-3T3-L1 adipocytes were elevated with the increase in IH cycles; the mRNA expression of IRS-1 was decreased after IH 32 cycles and lower than that of the SH group. For the study in vivo, Oil Red O staining showed a more obvious AS aortic plaque in the CIH group. After CIH treatment of 4 w and 8 w, fasting blood glucose (FBG) of the NC group and CIH group was higher than that of the Con group, and the insulin level of the CIH group was higher than that of the Con group after IH treatment of 8 w. The expressions of the IRS-1 mRNA level in the aorta, skeletal muscle, and liver of the CIH group were lower than those in the Con group. The mRNA and protein expression of SREBP-1c and its downstream molecule FAS in the aorta, skeletal muscle, and liver significantly enhanced in the CIH group in contrast with those in the Con group.

Conclusion: The CIH composite AGM could promote the progress of AS, which might be related to the modulation of the expression of SREBP-1-related molecular pathways.


Figures

Figure 1
Figure 1
Differentiated and mature 3T3-L1 adipocytes (Oil Red O staining).
Figure 2
Figure 2
Schematic diagram of IH treatment (in vitro) and CIH treatment (in vivo). (a) Schematic diagram of IH treatment (in vitro); (b) IH treatment cycle pattern (in vitro); (c) schematic diagram of CIH treatment (in vivo); (d) CIH treatment hypoxia cycle pattern (in vivo).
Figure 3
Figure 3
Effect of different numbers of IH cycles on SREBP-1c mRNA expression (n = 9) (compared with IH0 P < 0.05, compared with IH2 #P < 0.05, compared with IH4 P < 0.05, and compared with IH8 P < 0.05.)
Figure 4
Figure 4
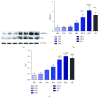
Effect of different numbers of IH cycles on SREBP-1 and FAS expression (n = 9) (a) Representative Western blotting result. (b) Compared with IH0 P < 0.05, compared with IH2 #P < 0.05, compared with IH4 P < 0.05, compared with IH8 P < 0.05. (c) Compared with IH0 P < 0.05, compared with IH2 P < 0.05, compared with IH4 ΦP < 0.05, and compared with IH8 ΨP < 0.05.
Figure 5
Figure 5
Effect of different numbers of IH cycles on IRS-1 mRNA expression (n = 9) (IH32 vs IH0 or IH2 P < 0.05, IH32 vs SH #P < 0.05).
Figure 6
Figure 6
The level of FBG and serum insulin in the Con group, NC group, and CIH group. (a) FBG at CIH treatment at 4 w, (b) FBG at CIH treatment at 8 w, and (c) serum insulin at CIH treatment at 8 w.
Figure 7
Figure 7
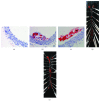
Aortic atherosclerotic plaques (Oil Red O staining). (a–c) Aortic atherosclerotic plaques in the ascending aorta: (a) Con group, (b) NC group, and (c) CIH group. (d, e) The longitudinal sections of the aorta in the NC and CIH group: (d) NC group and (e) CIH group.
Figure 8
Figure 8
Effect of CIH treatment on SREBP-1c and FAS expression in different tissues (n = 6). (a) The first line showed SREBP-1c mRNA expression: aorta, compared with Con P < 0.05; skeletal muscle, compared with Con #P < 0.05; and liver, compared with Con P < 0.05. The second line showed SREBP-1 protein expression: aorta, compared with Con P < 0.05, compared with NC #P < 0.05; skeletal muscle, compared with Con P < 0.05; and liver, compared with Con φP < 0.05. The third line showed FAS protein expression: aorta, compared with Con P < 0.05; skeletal muscle, compared with Con #P < 0.05, compared with NC P < 0.05; and liver, P > 0.05. (b) Representative Western blotting result of SREBP-1. (c) Representative Western blotting result of FAS.
Figure 9
Figure 9
Effect of CIH treatment on IRS-1 mRNA expression and pIRS-1 expression in different tissues (n = 6). (a) The first line showed IRS-1 mRNA expression: aorta, compared with Con P < 0.05; skeletal muscle, compared with Con #P < 0.05; and liver, compared with Con P < 0.05. The second line showed pIRS-1 protein: aorta, compared with Con P < 0.05, compared with NC #P < 0.05; skeletal muscle, compared with Con P < 0.05; and liver, compared with Con P < 0.05. (b) Representative Western blotting result.

Similar articles

Cited by

References

    1. Sleiman L., Beanlands R., Hasu M., et al. Loss of cellular inhibitor of apoptosis protein 2 reduces atherosclerosis in atherogenic apoE−/− C57BL/6 mice on high-fat diet. Journal of the American Heart Association. 2013;2(5, article e000259) doi: 10.1161/JAHA.113.000259. - DOI - PMC - PubMed
    1. Almalki A. L., Sayed A. A. R., Rabey H. A. E. Proanthocyanidin attenuation of oxidative stress and NF-κB protects apolipoprotein E-deficient mice against diabetic nephropathy. Evidence-based Complementary and Alternative Medicine. 2013;2013:8. doi: 10.1155/2013/769409.769409 - DOI - PMC - PubMed
    1. Hanssen N. M., Brouwers O., Gijbels M. J., et al. Glyoxalase 1 overexpression does not affect atherosclerotic lesion size and severity in ApoE−/− mice with or without diabetes. Cardiovascular Research. 2014;104(1):160–170. doi: 10.1093/cvr/cvu189. - DOI - PubMed
    1. Bradley T. D., Floras J. S. Obstructive sleep apnoea and its cardiovascular consequences. The Lancet. 2009;373(9657):82–93. doi: 10.1016/S0140-6736(08)61622-0. - DOI - PubMed
    1. Bazan V., Grau N., Valles E., et al. Obstructive sleep apnea in patients with typical atrial flutter: prevalence and impact on arrhythmia control outcome. Chest. 2013;143(5):1277–1283. doi: 10.1378/chest.12-0697. - DOI - PubMed

Substances