. 2019 Feb 12;10(13):1284-1305.
doi: 10.18632/oncotarget.26641.

A novel therapeutic approach to colorectal cancer in diabetes: role of metformin and rapamycin

Affiliations

A novel therapeutic approach to colorectal cancer in diabetes: role of metformin and rapamycin

Alice Gerges Geagea et al. Oncotarget. .

Erratum in

Abstract

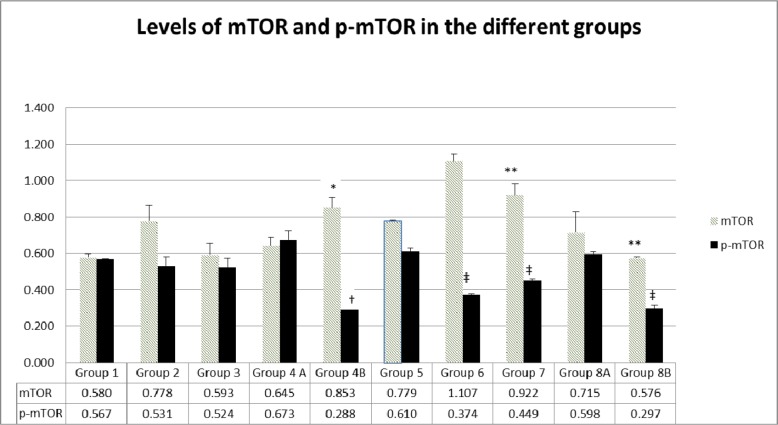
The link between colorectal cancer (CRC), diabetes mellitus (DM) and inflammation is well established, and polytherapy, including rapamycin, has been adopted. This study is a novel approach that aimed at assessing the effect of a combination therapy of metformin and rapamycin on the control or prevention of CRC in diabetic animals, in presence or absence of probiotics. Fifty NOD/SCIDs male mice developed xenograft by inoculating HCT116 cells. They were equally divided into diabetics (induced by Streptozotocin) and non-diabetics. Metformin was given in drinking water, whereas rapamycin was administered via intra-peritoneal injections. Probiotics were added to the double therapy two weeks before the sacrifice. Assessment was performed by clinical observation, histological analysis, Reactive oxygen species (ROS) activities and molecular analysis of Interleukin 3 and 6, Tumor Necrosis Factor alpha, AMP-activated protein Kinase and the mammalian target of rapamycin. Decreases in the level of tumorigenesis resulted, to various extents, with the different treatment regimens. The combination of rapamycin and metformin had no significant result, however, after adding probiotics to the combination, there was a marked delay in tumor formation and reduction of its size, suppression of ROS and a decrease in inflammatory cytokines as well as an inhibition of phosphorylated mTOR. Existing evidence clearly supports the use of rapamycin and metformin especially in the presence of probiotics. It also highlighted the possible mechanism of action of the 2 drugs through AMPK and mTOR signaling pathways and offered preliminary data on the significant role of probiotics in the combination. Further investigation to clarify the exact role of probiotics and decipher in more details the involved pathways is needed.

Keywords: colorectal cancer; diabetes mellitus; inflammatory cytokines; mTOR; probiotics.


Conflict of interest statement

CONFLICTS OF INTEREST The authors declare that there is no conflict of interest regarding the publication of this article.

Figures

Figure 1
Figure 1. Blood glucose time curve
Note the difference in Glycemia levels between diabetic and non-diabetic groups, as well as the drop in glycemia in diabetic animals in groups 7, 8A and 8B treated respectively with metformin alone, metformin and rapamycin, probiotics with metformin and rapamycin.
Figure 2
Figure 2. Disease activity index (DAI) in the different groups
The values represent mean ± SEM (n = 6). Significance of p<0.05 was indicated by (*) and (**) when compared to diabetic control and non-diabetic control respectively.
Figure 3
Figure 3. Tumor volumes upon sacrifice
There was no additive effect of the combination therapy. In diabetics, group 8B, the probiotics with the combination had a significant antitumor effect. The values represent mean ± SEM (n = 6). Significance of p<0.05 was indicated by (*) and (**) when compared to diabetic control and non-diabetic control respectively.
Figure 4
Figure 4. Prototype of tumors upon sacrifice, formed in non-diabetic and diabetic mice treated with rapamycin, metformin and their combination with probiotics
Note the difference in tumor size in the different groups; animals from groups 4B and 8B treated with rapamycin and metformin in combination with probiotics had significantly smaller tumor size when compared to groups treated with Met alone, rapamycin alone or untreated animals.
Figure 5
Figure 5. H&E histological examination of the representative HCT116 xenograft tumors in the different groups
(A) a 200x magnification of a tumor section in non-diabetic, injected with HCT116 cells and non-treated showing high cellular density, vascularization (black arrows), and tumor cells surrounded by a remarkable infiltration of inflammatory cells (red arrows). (B) a 20x magnification showing some necrotic areas in the tumor (Black arrows) in non-diabetics, rapamycin alone (G2) (C) 20x magnification showing some necrotic areas in the tumor (Black arrows) in non-diabetics metformin alone (D) 4x and (E) 200x magnification show large necrotic areas in the tumor section with low cell density (black arrows) in non-diabetics treated with metformin combined to rapamycin. (F) 40x and (G) 200x magnification showing necrotic areas (Black arrows), along with a lower density of the cells in diabetic treated with metformin, rapamycin combined with probiotics (G4B). Note that all tumors from 5 animals in the same group showed similar morphology. (H) Whole view of a well-demarcated tumor formed with a scanty fibrous capsule and a moderately produced connective tissue in diabetic non-treated animals. Note the sheet-like proliferation showing growth of solid tumor cells. (I) 200x magnification of the tumor section in G5, note the high density of the cells along with increase in vascularity (black arrows) (J) 200x magnification of a tumor section, showing a moderate cells density along with an increase in vascularity (black arrows) in diabetics treated with rapamycin alone (G6). (K) 200x magnification of a tumor section, note the moderate density of the cells in diabetics treated with metformin alone (G7). (L) 200x magnification of tumor section from diabetic mice treated with metformin and rapamycin showing a lesser density of the cells than either alone (M) 200x and (N) 20x magnification of tumor section from diabetic mice with the triple therapy showing necrotic areas (Black arrows), along with a significant decrease in cellular density.
Figure 6
Figure 6. High power magnification of H&E stained colonic tissue obtained from the different groups
(A and F) represent colon sections from non-treated animals, respectively non-diabetic and diabetic showing a marked hyperplasia with loss of goblet cells (black circles), polyp formation (star shape) and inflammatory cells infiltration (black arrows) seen in animals as well as thinning of the colonic layers (dotted circle) and extensive crypt dysregulation (star shape). (B and G) animals treated with rapamycin alone in non-diabetic (G2) and diabetic (G7), respectively show few inflammatory cell aggregates (black arrows), in addition to some dysregulation in epithelial cell lining and the sub-mucosal edema (star shape). Colon sections in (C and H) from animals treated with metformin alone, in non-diabetics and diabetics, respectively, showing few inflammatory cell aggregates (black arrows) and a close to normal colonic structure. (D and I) show normal colonic structure and normal goblet cell distribution, in addition to a moderate and sub-mucosal edema (star shape) in non-diabetic and diabetic animals treated with metformin and rapamycin. An almost normal colonic structure is seen in animals treated with rapamycin probiotics and metformin as in (E and J).
Figure 7
Figure 7. Colonic inflammation average in the different groups
Note the significant drop in inflammation in groups treated with metformin, rapamycin and probiotics (group 4B and 8B) where the lowest scores were obtained (0.1). The values represent mean ± SEM (n = 6). Significance of p<0.05 was indicated by (*) when compared to diabetic control, and non-diabetic control (**); and (***) indicated significance between G8A and 8B.
Figure 8
Figure 8
(A and B) Toluidine Blue stained colonic section (13A) showing a typical mast cell (black arrow) seen in the submucosa of an inflamed colon (13B 400X magnification).
Figure 9
Figure 9. Quantification of mast cell numbers
Note that the highest numbers of mast cells were obtained in groups 1 and 5. Treatment with metformin and rapamycin alone or in combination with probiotics were able to reduce the mast cells number in a significant manner. The lowest values were obtained in group 4B and 8B when probiotics were administrated to mice in addition to the metformin and rapamycin’s combination. The values represent mean ± SEM (n = 6). Significance of p<0.05 was indicated by (*) when compared to diabetic control, and non-diabetic control (**).
Figure 10
Figure 10. Quantification of ROS formation in the different diabetic and non-diabetic groups
Note that the highest ROS levels were obtained in the non-treated groups (1 and 5), the different treatments and their combinations were able to reduce ROS levels to a various extent in a significant manner. The values represent mean ± SEM (n = 6). Significance of p<0.05 was indicated by (*) when compared to diabetic control, and non-diabetic control (**).
Figure 11
Figure 11. DHE staining in non–diabetic animals, groups 1, 2, 3, 4A and 4B, as well as in diabetic animals (groups 5, 6, 7, 8A and 8B) showing the difference in stain intensity when comparing the non-treated group 1 and 5 to the treated groups
Note that the lowest red fluorescence was obtained in group 4B and 8B treated with the combination of metformin, rapamycin and probiotics.
Figure 12
Figure 12
(A and B) Expression of main genes involved in colorectal carcinogenesis. The values represent mean ± SEM (n = 6). Significance of p<0.05 was indicated by (*) and (**) when compared to diabetic control and non-diabetic control respectively.
Figure 13
Figure 13. Assessment of proliferation via KI67
The values represent mean ± SEM (n = 6). Significance of p<0.05 was indicated by (*) and (**) when compared to diabetic control and non-diabetic control respectively.
Figure 14
Figure 14
(A, B, C) Expression of main genes involved in inflammation. The values represent mean ± SEM (n = 6). Significance of p<0.05 was indicated by (*) and (**) when compared to diabetic control and non-diabetic control respectively.
Figure 15
Figure 15. Expression of mTOR and p-mTOR at protein level in the different groups
The values represent mean ± SEM (n = 6). Significance of p<0.05 was indicated by (*) and (†) when compared to diabetic control, (**) and (‡) when compared with non-diabetic control (**) for mTOR and p-mTOR respectively.
Figure 16
Figure 16. Proposed mechanism of action of the tri-therapy

References

    1. Cannata D, Fierz Y, Vijayakumar A, LeRoith D. Type 2 diabetes and cancer: what is the connection? Mount Sinai Journal of Medicine: A Journal of Translational and Personalized Medicine. 2010;77:197–213. - PubMed
    1. Tomasello G, Tralongo P, Damiani P, Sinagra E, Di Trapani B, Zeenny MN, Hussein IH, Jurjus A, Leone A. Dismicrobism in inflammatory bowel disease and colorectal cancer: changes in response of colocytes. World Journal of Gastroenterology: WJG. 2014;20:18121. - PMC - PubMed
    1. Cheng I, Caberto CP, Lum-Jones A, Seifried A, Wilkens LR, Schumacher FR, Monroe KR, Lim U, Tiirikainen M, Kolonel LN. Type 2 diabetes risk variants and colorectal cancer risk: the Multiethnic Cohort and PAGE studies. Gut. 2011;60:1703–11. - PMC - PubMed
    1. Basso P, Fonseca M, Bonfá G, Alves V, Sales-Campos H, Nardini V, Cardoso C. Association among genetic predisposition, gut microbiota, and host immune response in the etiopathogenesis of inflammatory bowel disease. Brazilian Journal of Medical and Biological Research. 2014;47:727–37. - PMC - PubMed
    1. Fischbach S, Gittes GK. The Role of TGF-[Beta] Signaling in [Beta]-Cell Dysfunction and Type 2 Diabetes: A Review. Journal of Cytology & Histology. 2014;5:1.