. 2019 Feb 19;10(15):1491-1506.
doi: 10.18632/oncotarget.26673.

The X-linked tumor suppressor TSPX downregulates cancer-drivers/oncogenes in prostate cancer in a C-terminal acidic domain dependent manner

Affiliations

The X-linked tumor suppressor TSPX downregulates cancer-drivers/oncogenes in prostate cancer in a C-terminal acidic domain dependent manner

Tatsuo Kido et al. Oncotarget. .

Abstract

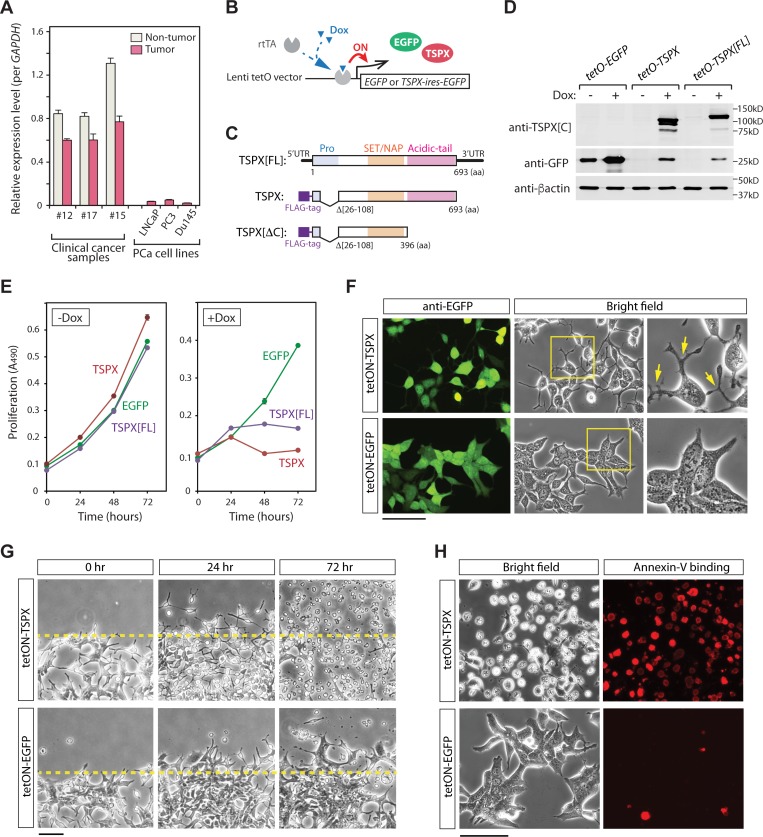
TSPX is a tumor suppressor gene located at Xp11.22, a prostate cancer susceptibility locus. It is ubiquitously expressed in most tissues but frequently downregulated in various cancers, including lung, brain, liver and prostate cancers. The C-terminal acidic domain (CAD) of TSPX is crucial for the tumor suppressor functions, such as inhibition of cyclin B/CDK1 phosphorylation and androgen receptor transactivation. Currently, the exact role of the TSPX CAD in transcriptional regulation of downstream genes is still uncertain. Using different variants of TSPX, we showed that overexpression of either TSPX, that harbors a CAD, or a CAD-truncated variant (TSPX[∆C]) drastically retarded cell proliferation in a prostate cancer cell line LNCaP, but cell death was induced only by overexpression of TSPX. Transcriptome analyses showed that TSPX or TSPX[∆C] overexpression downregulated multiple cancer-drivers/oncogenes, including MYC and MYB, in a CAD-dependent manner and upregulated various tumor suppressors in a CAD-independent manner. Datamining of transcriptomes of prostate cancer specimens in the Cancer Genome Atlas (TCGA) dataset confirmed the negative correlation between the expression level of TSPX and those of MYC and MYB in clinical prostate cancer, thereby supporting the hypothesis that the CAD of TSPX plays an important role in suppression of cancer-drivers/oncogenes in prostatic oncogenesis.

Keywords: TCGA; oncogene; prostate cancer; transcriptome analyses; tumor suppressor.


Conflict of interest statement

CONFLICTS OF INTEREST None.

Figures

Figure 1
Figure 1. The expression level of TSPX was frequently down-regulated in clinical prostate cancer
(A) Results of real-time qRT-PCR analysis of the TSPX expression levels in 15 prostate cancer tumor/non-tumor paired samples obtained from the Cooperative Human Tissue Network (CHTN). Expression values were normalized against GAPDH, and samples from the same patient are linked with a solid line respectively. Green indicate down-regulated cases, and red indicate up-regulated cases. Gray dotted lines indicate no significant change between non-tumor and tumor samples (P > 0.05). (B) Results of datamining of the RNA-Seq dataset from 52 prostate cancer tumor/non-tumor paired samples from the Cancer Genome Atlas (TCGA). Expression values (normalized count values) were plotted, and samples from the same patient are linked with a straight line as described above.
Figure 2
Figure 2. Overexpression of TSPX caused morphological changes and cell-death in LNCaP cells
(A) Comparison of the expression levels of TSPX among clinical prostate cancer samples and prostate cancer cell lines, LNCaP, PC3 and DU145. The expression levels were measured by qRT-PCR and normalized against GAPDH. (B) A schematic diagram of tet-ON system. In the presence of doxycycline (Dox), a transactivator rtTA is recruited on to the promoter region, and turns on the expression of transgene. (C) A diagrammatic illustration of transgene constructs for TSPX[FL], TSPX, and TSPX[ΔC]. (D) Western blot confirmed the expressions of EGFP and TSPX variants in the respective transduced LNCaP cells. β-actin was used as an internal and loading control. (E) Cell proliferation assay showed that expression of TSPX[FL] or TSPX (+Dox) inhibited cell proliferation, as compared to non-expressors (-Dox) or EGFP alone. (F) Cell morphologies of LNCaP-tetON-TSPX and LNCaP-tetON-EGFP cells at 24 hours after transgene induction. The co-expression of EGFP was confirmed by immunofluorescence (green). The TSPX overexpression induced morphological changes to round shapes with dendrite-like protrusions in LNCaP cells (arrows), but not EGFP alone. Far right panels show magnified images of the boxed area in the middle panels. (G) Scratch tests for LNCaP-tetON-TSPX cells (top) and LNCaP-tetON-EGFP cells (bottom) under transgene induction conditions. The morphology of LNCaP-tetON-TSPX cells dramatically changed by 24 hours, and numerous cells detached from the growing surface by 72 hours. (H) Annexin-V binding assay at 48 hours showed that the detached LNCaP-tetON-TSPX cells were positively stained by Annexin-V conjugated with Alexa Fluor 594 (red), corresponding to dead or apoptotic cells. Scale bar= 100 μm in F and H, 200 μm in G.
Figure 3
Figure 3. Effects of truncation of the CAD from TSPX in LNCaP cells
(A) Western blots confirming the expressions of EGFP and FLAG-tagged TSPX variants in the respective transduced LNCaP cells. (B) Bright-field and immunofluorescence images of the FLAG-tagged TSPX variants (red), and DAPI staining (blue) in the respective transduced LNCaP cells at 24 hours after Dox-induction. Far right panels show the merged images of anti-FLAG staining and DAPI staining in the boxed areas. (C) Cell proliferation assay showed that overexpression of TSPX or TSPX[ΔC] (+Dox) inhibited cell proliferation, as compared to non-expressers (-Dox) or EGFP alone. (D) Immunofluorescence of the BrdU incorporation (red) for LNCaP-tetON-EGFP cells and LNCaP-tetON-ΔC cells showed that cells overexpressing TSPX[ΔC] lacked DNA synthetic activities. (E) Quantified results of the BrdU incorporation assay. Bars indicate the percentage of BrdU-positive cells in the LNCaP-tetON-EGFP, LNCaP-tetON-TSPX, and LNCaP-tetON-TSPX[ΔC] population respectively. An asterisk indicates significance at P < 0.01. (F) Time dependent changes of LNCaP-tetON-TSPX cells (top) and LNCaP-tetON-ΔC cells (bottom) after Dox-induction of respective transgenes. Bright-field images of the same area at the indicated time points are presented. Far right panels show magnified images of the boxed area in the middle panels. (G) Annexin-V binding assay (red) at 48 hours after Dox-induction showed that only LNCaP-tetON-TSPX cells were positive for this apoptotic marker, but not LNCaP-tetON-ΔC cells. EGFP green fluorescence in living cells are also presented on the left. Scale bar= 50 μm in B, 200 μm in E, 100 μm in F and G.
Figure 4
Figure 4. Comparative analysis of the transcriptomes of the LNCaP-tetON-TSPX and LNCaP-tetON-ΔC cells and identification of the CAD-dependent, CAD-enhanced, and CAD-independent differentially expressed genes (DEGs)
(A) MA plots representing the gene expression changes mediated by TSPX-overexpression in LNCaP cells. Red plots indicate the CAD-dependent DEGs, orange plots indicate the DEGs whose expression changes were enhanced by CAD (CAD-enhanced), and blue plots indicate the CAD-independent DEGs. Gray plots indicate non-differentially expressed genes (non-DEG). (B) Venn diagram showing the number of genes classified into the CAD-dependent, CAD-enhanced, and CAD-independent DEGs, respectively. (C) Results of Ingenuity Pathway Analysis (IPA) for DEGs mediated by TSPX-overexpression in LNCaP cells. Top ten biological functions identified among the DEGs are presented. A dark blue line indicates -log10(P-value) and bars indicate the numbers of DEGs associated with respective pathways. Bar colors indicate CAD-dependent (red), CAD-enhanced (orange), and CAD-independent (blue) DEGs respectively. (D, top panel) The relative expression levels of CDKN1A, BAX, and MYC in the Dox-induced LNCaP-tetON-EGFP (EGFP), LNCaP-tetON-ΔC (ΔC), and LNCaP-tetON-TSPX (TSPX) cells. Expression values are presented based on the normalized RNA-Seq count data (n = 3) (mean ± SEM). RSP20 was shown as an internal control. (D, bottom panel) Western-blot confirmed the corresponding protein expression of CDKN1A, BAX, and MYC in the Dox-treated LNCaP-tetON-EGFP, LNCaP-tetON-ΔC, and LNCaP-tetON-TSPX cells. Ratio values indicate the relative band-intensity normalized to RSP20 respectively.
Figure 5
Figure 5. Identification of the consistent downstream genes of TSPX (TSPX-target genes) in both clinical prostate cancer samples and LNCaP cells
(A) Based on the TSPX expression level, prostate cancer cases were classified into the TSPX-high group (highest 25 cases), the TSPX-low group (lowest 25 cases), and TSPX-mid group (the remainder of 447 cases) of 497 prostate cancer specimens. (B) Volcano plot representing the DEGs between TSPX-high and TSPX-low prostate cancer groups (red plots) with a FDR < 0.005. (C) Ingenuity Pathway Analysis (IPA) of DEGs between TSPX-high and TSPX-low expression level in prostate cancer. Top ten biological functions identified among the DEGs are presented. Red line indicates -log10(P-value) and bars indicate the numbers of DEGs associated with respective pathways. (D) A graph plotting the 166 TSPX-target genes whose expression levels (up or down) were consistently corresponded with those of TSPX in both clinical prostate cancer samples (X-axis) and LNCaP cells (Y-axis). Plot color indicates CAD-dependent (red), CAD-enhanced (orange), and CAD-independent (blue), respectively. (E) Venn diagram summarizing the number of CAD-dependent, CAD-enhanced, and CAD-independent TSPX-target genes. (F) The relative expression levels of SEMA3B, BTG2, MYB, and AR, in the Dox-induced LNCaP-tetON-EGFP, LNCaP-tetON-ΔC, and LNCaP-tetON-TSPX cells. Expression values are normalized RNA-Seq count data (n = 3) (mean ± SEM). Asterisks indicate the Student’s t-test P-value < 0.05. (G) The gene expression patterns of TSPX- SEMA3B, BTG2, MYB, and AR, in clinical samples. Relative expression levels in non-tumor prostate tissues (NT), TSPX-low prostate cancer (PCa) group, TSPX-mid PCa group, and TSPX-high PCa group. Asterisk indicates the Student’s t-test P-value < 0.05.
Figure 6
Figure 6. A schematic diagram illustrating the likely mechanism(s) of the TSPX-mediated suppression of the MYC gene
TSPX interacts with the MYC promoter region via its SET/NAP domain, and the C-terminal acidic domain (CAD) plays an important role to suppress the MYC gene, likely by recruiting co-repressors to the promoter. Other cancer-drivers/oncogenes that were downregulated by TSPX may be also regulated in the similar manner(s).

Similar articles

Cited by

References

    1. World Cancer Research Fund International 2018. Available at: http://www.wcrf.org/int/cancer-facts-figures/data-specific-cancers/prost....
    1. Siegel RL, Miller KD, Jemal A. Cancer statistics, 2015. CA Cancer J Clin. 2015;65:5–29. - PubMed
    1. Kote-Jarai Z, Olama AA, Giles GG, Severi G, Schleutker J, Weischer M, Campa D, Riboli E, Key T, Gronberg H, Hunter DJ, Kraft P, Thun MJ, et al. Seven prostate cancer susceptibility loci identified by a multi-stage genome-wide association study. Nat Genet. 2011;43:785–91. - PMC - PubMed
    1. Eeles RA, Olama AA, Benlloch S, Saunders EJ, Leongamornlert DA, Tymrakiewicz M, Ghoussaini M, Luccarini C, Dennis J, Jugurnauth-Little S, Dadaev T, Neal DE, Hamdy FC, et al. Identification of 23 new prostate cancer susceptibility loci using the iCOGS custom genotyping array. Nat Genet. 2013;45:385–91. 91e1-2. - PMC - PubMed
    1. Van der Meulen J, Sanghvi V, Mavrakis K, Durinck K, Fang F, Matthijssens F, Rondou P, Rosen M, Pieters T, Vandenberghe P, Delabesse E, Lammens T, De Moerloose B, et al. The H3K27me3 demethylase UTX is a gender-specific tumor suppressor in T-cell acute lymphoblastic leukemia. Blood. 2015;125:13–21. - PMC - PubMed