Association of Autoantibodies against M2-Muscarinic Acetylcholine Receptor with Atrial Fibrosis in Atrial Fibrillation Patients
- PMID: 30863630
- PMCID: PMC6378765
- DOI: 10.1155/2019/8271871
Association of Autoantibodies against M2-Muscarinic Acetylcholine Receptor with Atrial Fibrosis in Atrial Fibrillation Patients
Abstract
Objectives: To investigate the association of serum autoantibodies against M2-muscarinic acetylcholine receptor (anti-M2-R) with atrial fibrosis in long-standing persistent atrial fibrillation (AF) patients.
Methods: Twenty-four long-standing persistent AF patients, scheduled to undergo hybrid ablation surgery, were enrolled in the study. Twenty-six patients with sinus rhythm, scheduled to undergo coronary artery bypass grafting surgery, were enrolled into the non-AF group. We detected serum anti-M2-R levels. Left atrial appendages were subjected to histological and molecular biological assays. Patients in the AF group received follow-up for two years.
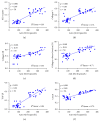
Results: The AF group showed significantly higher serum anti-M2-R levels compared to the non-AF group (496.2 ± 232.5 vs. 86.3 ± 25.7 pmol/L, p < 0.001). The AF group exhibited severe fibrosis in the left atrial appendages, as indicated by increased collagen volume fraction (45.2 ± 4.7% vs. 27.6 ± 8.3%, p < 0.001), and higher levels of collagen I (0.52 ± 0.04 vs. 0.24 ± 0.06, p < 0.001) and collagen III (0.51 ± 0.07 vs. 0.36 ± 0.09, p < 0.001). TGF-β1 and CTGF were also upregulated in the AF group. A positive correlation between serum anti-M2-R levels and fibrosis of the left atrial appendage and fibrogenic indexes was observed.
Conclusions: Serum anti-M2-R levels are higher in AF patients and are associated with the severity of atrial fibrosis. In addition, serum anti-M2-R levels are positively correlated to TGF-β1 and CTGF expression in the left atrial appendage.
Figures


Similar articles
-
M2-muscarinic acetylcholine receptor autoantibody levels predict left atrial fibrosis severity in paroxysmal lone atrial fibrillation patients undergoing cryoablation.Europace. 2015 Feb;17(2):239-46. doi: 10.1093/europace/euu228. Epub 2014 Sep 19. Europace. 2015. PMID: 25238749
-
Predictive value of pre-procedural autoantibodies against M2-muscarinic acetylcholine receptor for recurrence of atrial fibrillation one year after radiofrequency catheter ablation.J Transl Med. 2013 Jan 7;11:7. doi: 10.1186/1479-5876-11-7. J Transl Med. 2013. PMID: 23294565 Free PMC article.
-
Association of β1-Adrenergic, M2-Muscarinic Receptor Autoantibody with Occurrence and Development of Nonvalvular Atrial Fibrillation.Pacing Clin Electrophysiol. 2016 Dec;39(12):1379-1387. doi: 10.1111/pace.12976. Epub 2016 Dec 7. Pacing Clin Electrophysiol. 2016. PMID: 27862036
-
Cardiac Autoantibody Levels Predict Recurrence Following Cryoballoon-Based Pulmonary Vein Isolation in Paroxysmal Atrial Fibrillation Patients.J Cardiovasc Electrophysiol. 2015 Jun;26(6):615-21. doi: 10.1111/jce.12665. Epub 2015 May 1. J Cardiovasc Electrophysiol. 2015. PMID: 25788224
-
Elevated M2-muscarinic and β1-adrenergic receptor autoantibody levels are associated with paroxysmal atrial fibrillation.Clin Res Cardiol. 2015 Mar;104(3):226-33. doi: 10.1007/s00392-014-0776-1. Epub 2014 Oct 29. Clin Res Cardiol. 2015. PMID: 25351416
Cited by
-
Autoantibodies in Atrial Fibrillation-State of the Art.Int J Mol Sci. 2023 Jan 17;24(3):1852. doi: 10.3390/ijms24031852. Int J Mol Sci. 2023. PMID: 36768174 Free PMC article. Review.
-
Pathophysiology of Atrial Fibrillation and Approach to Therapy in Subjects Less than 60 Years Old.Int J Mol Sci. 2024 Jan 7;25(2):758. doi: 10.3390/ijms25020758. Int J Mol Sci. 2024. PMID: 38255832 Free PMC article. Review.
-
Research progress in myocardial function and diseases related to muscarinic acetylcholine receptor (Review).Int J Mol Med. 2025 Jun;55(6):86. doi: 10.3892/ijmm.2025.5527. Epub 2025 Apr 4. Int J Mol Med. 2025. PMID: 40183403 Free PMC article. Review.
-
Elevated β1-Adrenergic Receptor Autoantibody Levels Increase Atrial Fibrillation Susceptibility by Promoting Atrial Fibrosis.Front Physiol. 2020 Feb 12;11:76. doi: 10.3389/fphys.2020.00076. eCollection 2020. Front Physiol. 2020. PMID: 32116783 Free PMC article.
-
Sex-specific and polygenic effects underlying resting heart rate and associated risk of cardiovascular disease.Eur J Prev Cardiol. 2024 Sep 20;31(13):1585-1594. doi: 10.1093/eurjpc/zwae092. Eur J Prev Cardiol. 2024. PMID: 38437179 Free PMC article.
References
-
- Kirchhof P., Benussi S., Kotecha D., et al. ESC guidelines for the management of atrial fibrillation developed in collaboration with EACTS. Europace. 2016;18:1609–1678. - PubMed
LinkOut - more resources
Full Text Sources
Miscellaneous
