Review
. 2019 Apr;48(3):213-229.
doi: 10.1007/s00249-019-01348-5. Epub 2019 Mar 13.

Two-dimensional mass spectrometry: new perspectives for tandem mass spectrometry

Affiliations
Review

Two-dimensional mass spectrometry: new perspectives for tandem mass spectrometry

Maria A van Agthoven et al. Eur Biophys J. 2019 Apr.

Abstract

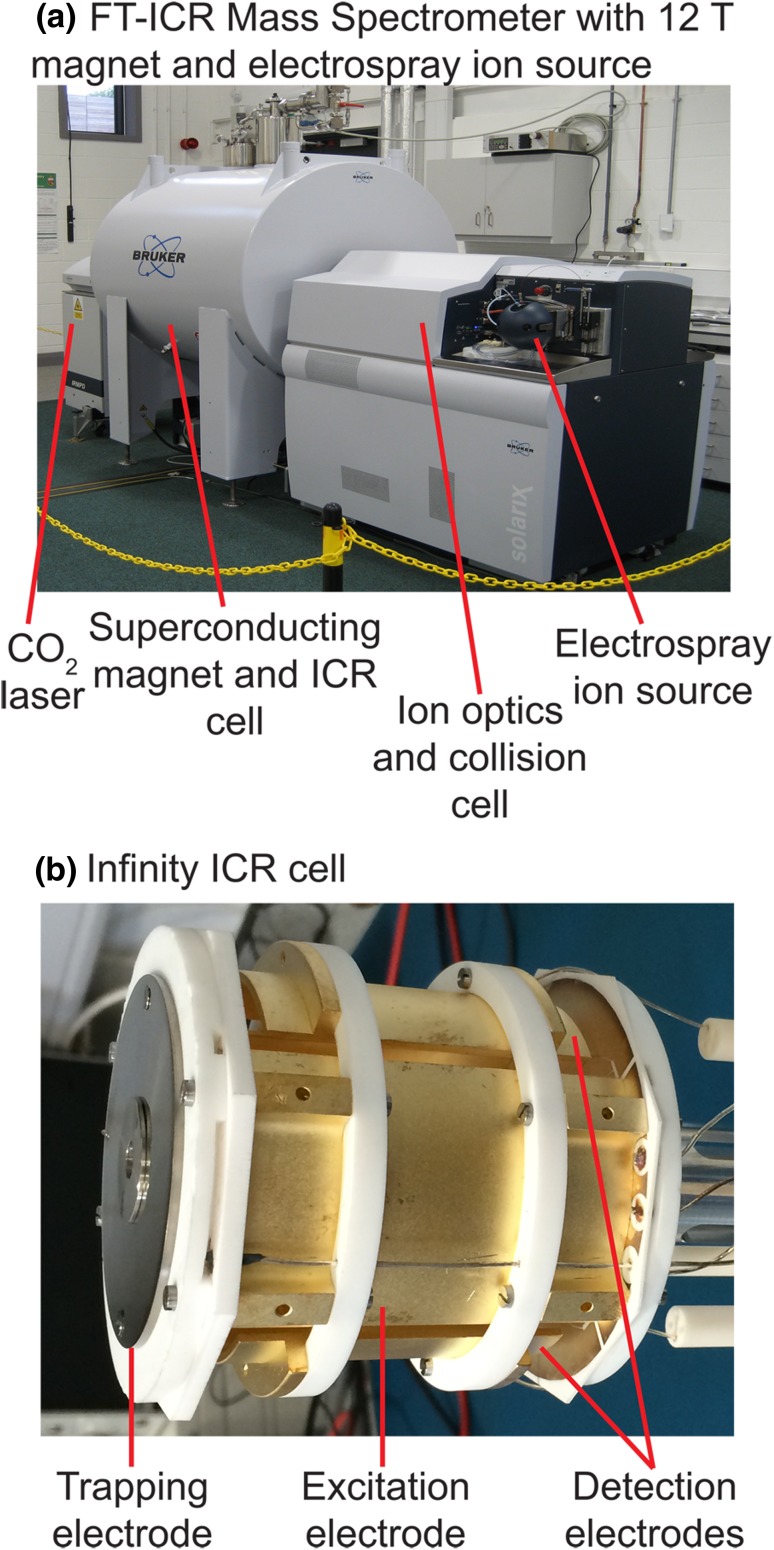
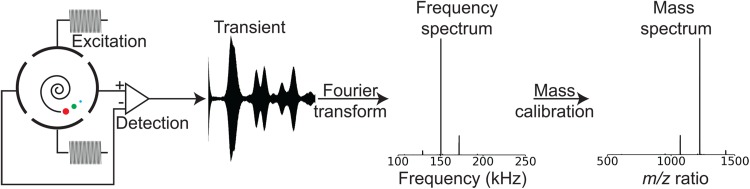
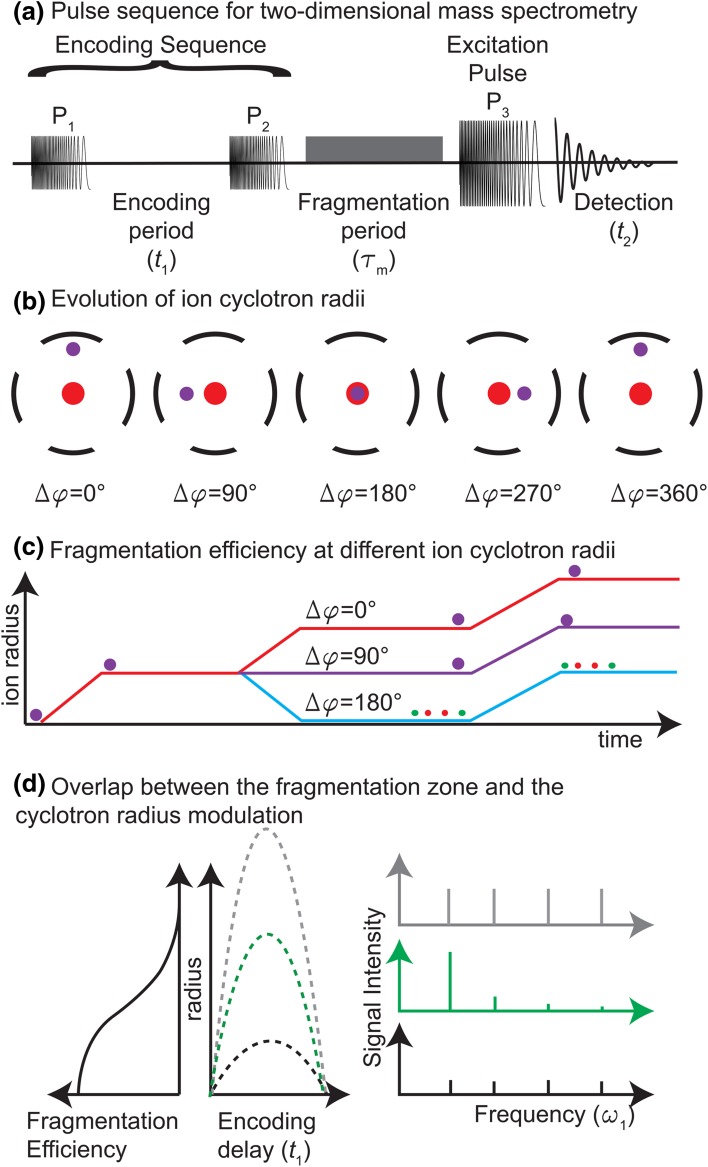
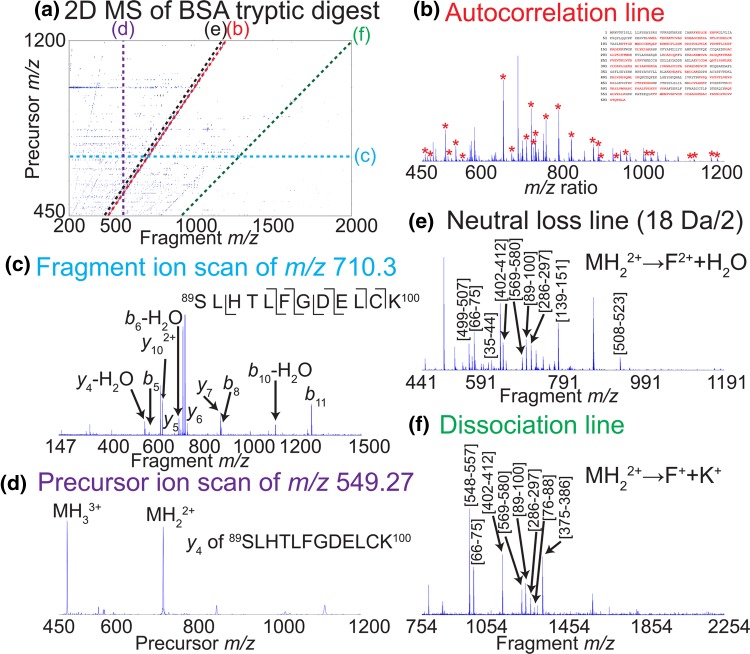
Fourier transform ion cyclotron resonance mass analysers (FT-ICR MS) can offer the highest resolutions and mass accuracies in mass spectrometry. Mass spectra acquired in an FT-ICR MS can yield accurate elemental compositions of all compounds in a complex sample. Fragmentation caused by ion-neutral, ion-electron, or ion-photon interactions leads to more detailed structural information on compounds. The most often used method to correlate compounds and their fragment ions is to isolate the precursor ions from the sample before fragmentation. Two-dimensional mass spectrometry (2D MS) offers a method to correlate precursor and fragment ions without requiring precursor isolation. 2D MS therefore enables easy access to the fragmentation patterns of all compounds from complex samples. In this article, the principles of FT-ICR MS are reviewed and the 2D MS experiment is explained. Data processing for 2D MS is detailed, and the interpretation of 2D mass spectra is described.

Keywords: Fourier transform; Fourier transform ion cyclotron resonance mass spectrometry; Mass spectrometry; Tandem mass spectrometry; Two dimensional.


Figures

Fig. 1
Fig. 1
a Photograph of a 12 T FT-ICR mass spectrometer with an electrospray ion source. Samples are ionized in the electrospray source and travel to the ICR cell in the centre of the superconducting magnet. The CO2 laser is used for fragmentation in the ICR cell. b Photograph of an Infinity ICR cell. The trapping electrodes are used to trap the ions axially. The excitation electrodes excite the ions to high radii and the detection electrodes detect mirror current generated by their motion
Fig. 2
Fig. 2
Acquisition and processing of a mass spectrum with an FT-ICR mass spectrometer. The mirror current is measured between the detection electrodes, amplified and converted into a voltage, and acquired. A FT yields the frequency spectrum, and a calibration by the frequency-to-mass conversion yields the mass spectrum
Fig. 3
Fig. 3
a Pulse sequence for a 2D MS experiment. The encoding sequence modulates the radius of the ions according to their cyclotron frequency and the delay t1. The radius-dependent fragmentation then modulates the abundance of the precursors and all ions are excited and detected. b Evolution of ion cyclotron radii during a 2D MS experiment. According to the product of their cyclotron frequency and the delay t1, the ion packets have different radii at the end of the encoding sequence. c Fragmentation efficiency at different cyclotron radii. The cyclotron radii of the ions after the encoding sequence determines the fragmentation efficiency. d Overlap between the fragmentation zone and the radius modulation. There is an optimal overlap between the fragmentation zone and the amplitude of the cyclotron radius modulation where multiple ω1 harmonics are minimized
Fig. 4
Fig. 4
a 2D IRMPD mass spectrum of bovine serum albumin tryptic digest. Each peak corresponds to a dissociation, with the m/z ratio of the precursor plotted vertically and the m/z ratio of the fragment plotted horizontally. b Autocorrelation line with assigned peaks and sequence coverage. The autocorrelation line shows the m/z ratios of the precursor ions. c Fragment ion scan of m/z 710.3. The fragment ion scan of each precursor ion can be extracted horizontally. d Precursor ion scan of m/z 549.27. The precursor ion scan of each fragment ion can be extracted vertically. e Neutral loss line of water by doubly charged precursors. Each neutral loss line can be extracted as a line that is parallel to the autocorrelation line. f Dissociation line for loss of lysine with one charge loss for doubly charged precursors. Each dissociation line is characterized by the charge states of the precursor and the fragment ions and by the mass that is lost
Fig. 5
Fig. 5
Three-dimensional representation of isotopic patterns in the 2D IRMPD mass spectrum of ubiquitin. a The experimental isotopic pattern of the y182+ fragment ion (m/z 1049.10 for the monoisotopic peak) shows the that the contributions from the precursor isotopes in each peak in the isotopic pattern of the fragment ion cannot be separated due to the insufficient resolving power in the vertical dimension. b The experimental isotopic pattern of the MH77+ precursor ion (m/z 1223.809664 for the monoisotopic peak) shows that the all the isotopic peaks of the precursor are on the autocorrelation line. c The theoretical isotopic pattern of the y182+ fragment ion shows the contribution of each precursor isotope to the isotopic peaks of the fragment ion. d The theoretical isotopic pattern of the MH77+ precursor ion shows the isotopic peaks of the precursor ion on the autocorrelation line
Fig. 6
Fig. 6
a 2D IRMPD spectrum of bovine serum albumin tryptic digest in the frequency domain. The position of the harmonics of the autocorrelation line are shown in both ω1 and ω2 axes, the rebound of the lines on the top and bottom of the frequency spectrum corresponds to the aliasing of the signal at frequencies higher than the Nyquist frequency. b 2D IRMPD spectrum in the m/z domain. The autocorrelation line is conserved but the other harmonics are curved, due to the inverse relationship between cyclotron frequencies and m/z ratio (cf. Eq. 1)
Fig. 7
Fig. 7
a 2D IRMPD mass spectrum of bovine serum albumin without denoising. b 2D IRMPD mass spectrum of bovine serum albumin after urQRd denoising (rank 15). The urQRd denoising removes the vertical noise stripes

References

    1. Agarwal A, Diedrich JK, Julian RR. Direct elucidation of disulfide bond partners using ultraviolet photodissociation mass spectrometry. Anal Chem. 2011;83:6455–6458. doi: 10.1021/ac201650v. - DOI - PubMed
    1. Aizikov K, Mathur R, O’Connor PB. The spontaneous loss of coherence catastrophe in fourier transform ion cyclotron resonance mass spectrometry. J Am Soc Mass Spectrom. 2009;20:247–256. doi: 10.1016/j.jasms.2008.09.028. - DOI - PMC - PubMed
    1. Amster IJ. Fourier transform mass spectrometry. J Mass Spectrom. 1996;31:1325–1337. doi: 10.1002/(SICI)1096-9888(199612)31:12<1325::AID-JMS453>3.0.CO;2-W. - DOI
    1. Bensimon M, Zhao G, Gäumann T. A method to generate phase continuity in two-dimensional Fourier transform ion cyclotron resonance mass spectrometry. Chem Phys Lett. 1989;157:97–100. doi: 10.1016/0009-2614(89)87215-X. - DOI
    1. Biemann K. Four decades of structure determination by mass spectrometry: from alkaloids to heparin. J Am Soc Mass Spectrom. 2002;13:1254–1272. doi: 10.1016/S1044-0305(02)00441-5. - DOI - PubMed

MeSH terms

LinkOut - more resources