. 2019 May;166(1):392-402.
doi: 10.1111/ppl.12962. Epub 2019 Mar 25.

Balancing energy supply during photosynthesis - a theoretical perspective

Affiliations

Balancing energy supply during photosynthesis - a theoretical perspective

Anna Matuszyńska et al. Physiol Plant. 2019 May.

Abstract

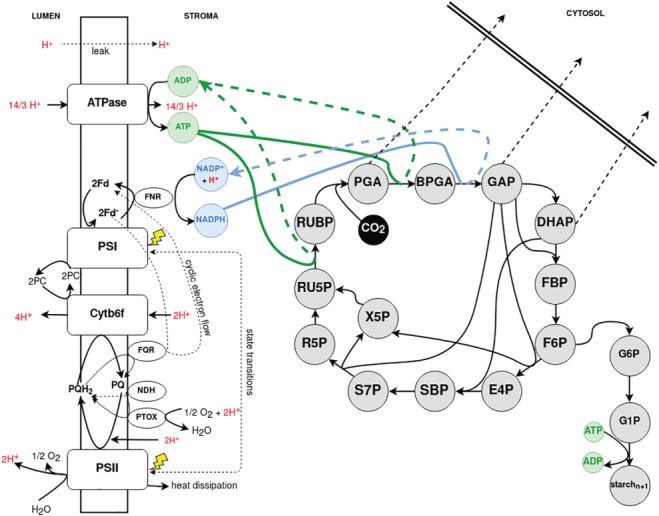
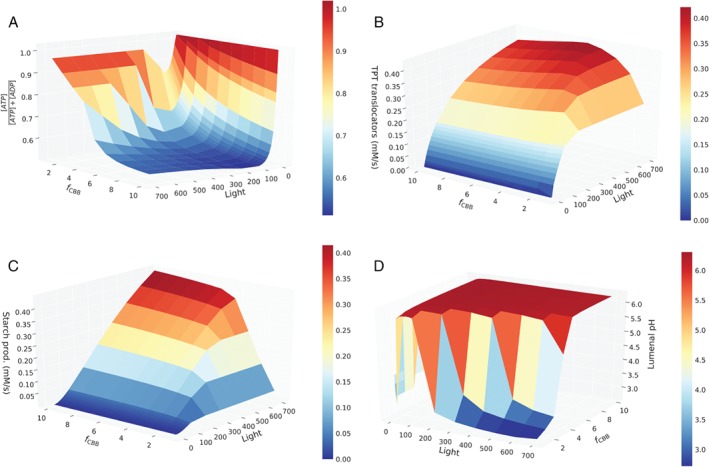
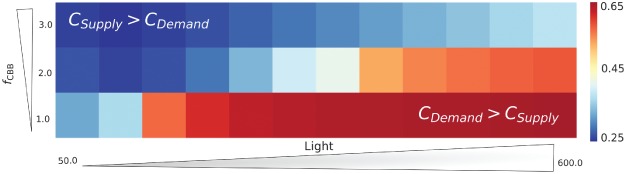
The photosynthetic electron transport chain (PETC) provides energy and redox equivalents for carbon fixation by the Calvin-Benson-Bassham (CBB) cycle. Both of these processes have been thoroughly investigated and the underlying molecular mechanisms are well known. However, it is far from understood by which mechanisms it is ensured that energy and redox supply by photosynthesis matches the demand of the downstream processes. Here, we deliver a theoretical analysis to quantitatively study the supply-demand regulation in photosynthesis. For this, we connect two previously developed models, one describing the PETC, originally developed to study non-photochemical quenching, and one providing a dynamic description of the photosynthetic carbon fixation in C3 plants, the CBB Cycle. The merged model explains how a tight regulation of supply and demand reactions leads to efficient carbon fixation. The model further illustrates that a stand-by mode is necessary in the dark to ensure that the carbon fixation cycle can be restarted after dark-light transitions, and it supports hypotheses, which reactions are responsible to generate such mode in vivo.


Figures

Figure 1
Figure 1
Schematic representation of the photosynthetic processes described by our merged mathematical model. The reactions take place in two compartments. In the lumen, the four protein supercomplexes (PSII, PSI, Cytb6f and ATPase) are embedded, which drive the electron transport in two modes, linear and cyclic; the stroma provides the compartment of C3 photosynthetic carbon fixation. The cytosol defines the system boundary. In color (green and blue) we have highlighted the reactions linking the two submodels: The production and consumption of ATP and NADPH, respectively.
Figure 2
Figure 2
Simulations of light–dark–light transitions for different light intensities, ranging from 20 to 200 μmol m−2 s−1. Shown are the dynamics of internal orthophosphate concentration, triose phosphate transporter (TPT) export and carbon fixation rates. The simulated time‐courses are shown from 200 s, when the system has reached a stationary state. From 300 to 500 s (gray area), the external light has been set to 5 μmol m−2 s−1. The figure illustrates that for low light intensities the CBB cycle fails to restart in the second light period.
Figure 3
Figure 3
Simulations in light intensity of 500 μmol m−2 s−1 for different initial concentrations of Ru5P, ranging from 0.35 to 0.5 mM. The Ru5P abundance is shown after 10 s, when the system is approximately equilibrated. The dashed line displays the critical concentration for sufficient cyclic activity after equilibrating. The figure displays that initial Ru5P concentrations below 0.44 mM result in a loss of Ru5P abundance.
Figure 4
Figure 4
Steady state simulations in low light intensity of 5 μmol m−2 s−1 and systematically increasing influxes of Ru5P from 0 to 0.08 mM s−1. The figure displays normalized ATP abundance, Ru5P concentration and lumenal pH.
Figure 5
Figure 5
Steady state analysis of the merged photosynthesis model under varying light intensities (x‐axis) and carbon fixation velocities (y‐axis). On the z‐axis (A) the relative ATP abundance, (B) TPT export flux, (C) starch production rate and (D) lumenal pH are displayed.
Figure 6
Figure 6
Normalized overall control of the demand reactions (C Demand) under different light intensities (x‐axis) and CBB cycle activities (y‐axis). The results show how the control shifts from the demand reactions under high light conditions, but low CBB activity, to the supply, under low light conditions but faster CBB cycle.

References

    1. Andersson I (2008) Catalysis and regulation in rubisco. J Exp Bot 59: 1555–1568 - PubMed
    1. Brandes HK, Larimer FW, Hartman FC (1996) The molecular pathway for the regulation of phosphoribulokinase by Thioredoxin f. J Biol Chem 271: 3333–3335 - PubMed
    1. Cardona T, Shao S, Nixon PJ (2018) Enhancing photosynthesis in plants: the light reactions. Essays Biochem 62: 85–94 - PMC - PubMed
    1. Chiadmi M, Navaza A, Miginiac‐Maslow M, Jacquot JP, Cherfils J (1999) Redox signalling in the chloroplast: structure of oxidized pea fructose‐1,6‐bisphosphate phosphatase. EMBO J 18: 6809–6815 - PMC - PubMed
    1. Christensen CD, Hofmeyr JHS, Rohwer JM (2015) Tracing regulatory routes in metabolism using generalised supply‐demand analysis. BMC Syst Biol 9: 1–18 - PMC - PubMed

MeSH terms

LinkOut - more resources