

In search of the most cost-effective monitoring strategy for vestibular schwannoma: A decision analytical modelling study
- PMID: 30864276
- PMCID: PMC6850121
- DOI: 10.1111/coa.13326
In search of the most cost-effective monitoring strategy for vestibular schwannoma: A decision analytical modelling study
Abstract
Objectives: To assess the cost-effectiveness of frequently used monitoring strategies for vestibular schwannoma (VS).
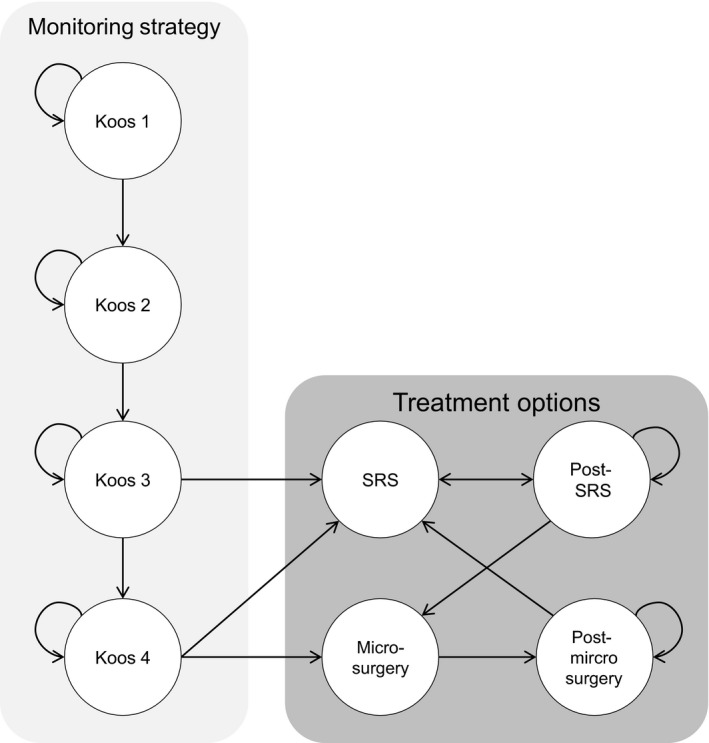
Design: A state transition model was developed to compare six monitoring strategies for patients with VS: lifelong annual monitoring; annual monitoring for the first 10 years after diagnosis; scanning at 1-5, 7, 9, 12, 15 years after diagnosis and subsequently every 5 years; a personalised monitoring strategy for small and large tumours; scanning at 1, 2 and 5 years after diagnosis and no monitoring. Input data were derived from literature and expert opinion. Quality-adjusted life years (QALYs) and healthcare costs of each strategy were modelled over lifetime. Net monetary benefits (NMBs) were calculated to determine which strategy provided most value for money. Sensitivity analyses were performed to address uncertainty.
Results: Omitting monitoring is least effective with 18.23 (95% CI 16.84-19.37) QALYs per patient, and lifelong annual monitoring is most effective with 18.66 (95% CI 17.42-19.65) QALYs. Corresponding costs were €6526 (95% CI 5923-7058) and €9429 (95% CI 9197-9643) per patient, respectively. Lifelong annual monitoring provided the best value with a NMB of €363 765 (339 040-383 697), but the overall probability of being most cost-effective compared to the other strategies was still only 23%. Sensitivity analysis shows that there is large uncertainty in the effectiveness of all strategies, with largely overlapping 95% confidence intervals for all strategies.
Conclusions: Due to the largely overlapping 95% confidence intervals of all monitoring strategies for VS, it is unclear which monitoring strategy provides most value for money at this moment.
Keywords: acoustic neuroma; cost-effectiveness analysis; magnetic resonance imaging; monitoring; vestibular schwannoma; wait and scan.
© 2019 The Authors. Clinical Otolaryngology Published by John Wiley & Sons Ltd.
Conflict of interest statement
There are no conflicts of interest.
Figures


Similar articles
-
Auditory brainstem response prior to MRI compared to standalone MRI in the detection of vestibular schwannoma: A modelling study.Clin Otolaryngol. 2022 Mar;47(2):295-303. doi: 10.1111/coa.13894. Epub 2021 Nov 24. Clin Otolaryngol. 2022. PMID: 34784107 Free PMC article.
-
Surgery is cost-effective treatment for young patients with vestibular schwannomas: decision tree modeling of surgery, radiation, and observation.Neurosurg Focus. 2014 Nov;37(5):E8. doi: 10.3171/2014.8.FOCUS14435. Neurosurg Focus. 2014. PMID: 26218621
-
Conservative management, surgery and radiosurgery for treatment of vestibular schwannomas: a model-based approach to cost-effectiveness.Clin Otolaryngol. 2014 Feb;39(1):22-31. doi: 10.1111/coa.12205. Clin Otolaryngol. 2014. PMID: 24313969
-
What is the best imaging strategy for acute stroke?Health Technol Assess. 2004 Jan;8(1):iii, ix-x, 1-180. doi: 10.3310/hta8010. Health Technol Assess. 2004. PMID: 14731377 Review.
-
The cost-effectiveness of screening for oral cancer in primary care.Health Technol Assess. 2006 Apr;10(14):1-144, iii-iv. doi: 10.3310/hta10140. Health Technol Assess. 2006. PMID: 16707071 Review.
Cited by
-
Auditory brainstem response prior to MRI compared to standalone MRI in the detection of vestibular schwannoma: A modelling study.Clin Otolaryngol. 2022 Mar;47(2):295-303. doi: 10.1111/coa.13894. Epub 2021 Nov 24. Clin Otolaryngol. 2022. PMID: 34784107 Free PMC article.
-
Cost considerations for vestibular schwannoma screening and imaging: a systematic review.Neurosurg Rev. 2024 Jan 22;47(1):59. doi: 10.1007/s10143-024-02305-3. Neurosurg Rev. 2024. PMID: 38252395
-
Development of a model to predict vestibular schwannoma growth: An opportunity to introduce new wait and scan strategies.Clin Otolaryngol. 2021 Jan;46(1):273-283. doi: 10.1111/coa.13661. Epub 2020 Nov 6. Clin Otolaryngol. 2021. PMID: 33090707 Free PMC article.
-
The Use of Expert Elicitation among Computational Modeling Studies in Health Research: A Systematic Review.Med Decis Making. 2022 Jul;42(5):684-703. doi: 10.1177/0272989X211053794. Epub 2021 Oct 25. Med Decis Making. 2022. PMID: 34694168 Free PMC article.
References
-
- Fortnum H, O'Neill C, Taylor R, et al. The role of magnetic resonance imaging in the identification of suspected acoustic neuroma: a systematic review of clinical and cost effectiveness and natural history. Health Technol Assess. 2009;13(18):525‐154. - PubMed
-
- Lin D, Hegarty JL, Fischbein NJ, Jackler RK. The prevalence of "incidental" acoustic neuroma. Arch Otolaryngol Head Neck Surg. 2005;131:241‐244. - PubMed
-
- Stangerup SE, Tos M, Thomsen J, Caye‐Thomasen P. True incidence of vestibular schwannoma? Neurosurgery. 2010;67:1335‐1340; discussion 1340. - PubMed
-
- Carlson ML, Link MJ, Wanna GB, Driscoll CL. Management of sporadic vestibular schwannoma. Otolaryngol Clin North Am. 2015;48:407‐422. - PubMed
-
- Conley GS, Hirsch BE. Stereotactic radiation treatment of vestibular schwannoma: indications, limitations, and outcomes. Curr Opin Otolaryngol Head Neck Surg. 2010;18:351‐356. - PubMed
MeSH terms
LinkOut - more resources
Full Text Sources
Medical
