. 2019 Apr 10;19(4):2641-2646.
doi: 10.1021/acs.nanolett.9b00508. Epub 2019 Mar 13.

124-Color Super-resolution Imaging by Engineering DNA-PAINT Blinking Kinetics

Affiliations

124-Color Super-resolution Imaging by Engineering DNA-PAINT Blinking Kinetics

Orsolya K Wade et al. Nano Lett. .

Abstract

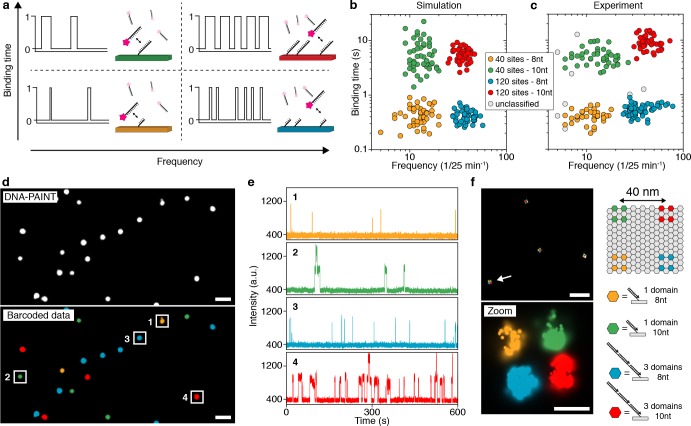
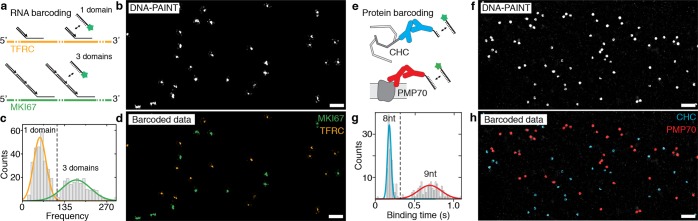
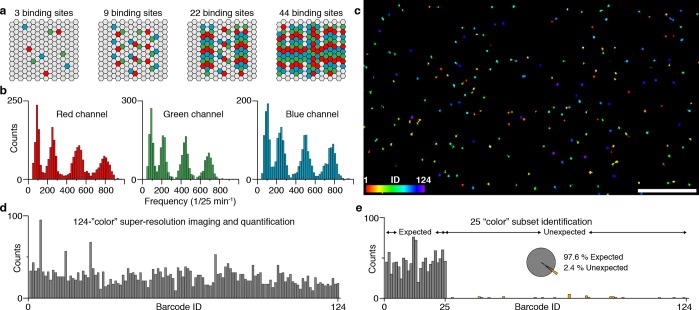
Optical super-resolution techniques reach unprecedented spatial resolution down to a few nanometers. However, efficient multiplexing strategies for the simultaneous detection of hundreds of molecular species are still elusive. Here, we introduce an entirely new approach to multiplexed super-resolution microscopy by designing the blinking behavior of targets with engineered binding frequency and duration in DNA-PAINT. We assay this kinetic barcoding approach in silico and in vitro using DNA origami structures, show the applicability for multiplexed RNA and protein detection in cells, and finally experimentally demonstrate 124-plex super-resolution imaging within minutes.

Keywords: DNA nanotechnology; DNA-PAINT; Super-resolution microscopy; barcoding; multiplexing.


Conflict of interest statement

The authors declare the following competing financial interest(s): J.B.W, R.J., and P.Y. filed a provisional patent based on this work. R.J. and P.Y. are co-founders of Ultivue, Inc.

Figures

Figure 1
Figure 1
Simultaneous multiplexed super-resolution imaging by engineering blinking kinetics. (a) Engineering blinking kinetics in DNA-PAINT allows the creation of “barcodes” for simultaneous multiplexing, using only a single imager strand species. Frequency can be encoded by designing a certain number of binding sites per target, e.g., a single binding site, leading to a defined blinking frequency. Tripling the number of binding sites triples the blinking frequency (left to right). Similarly, binding duration can be engineered by adjusting the length of the docking strand on a specific target: an 8 nt docking sequence will lead to a “short” binding duration, while a 10 nt docking sequence will result in longer binding (bottom to top). (b) Simulations of four kinetically different structures (40 and 120 binding sites and 8 and 10 nt lengths) show four clearly distinguishable populations corresponding to the engineered frequency and duration levels (see Supplementary Figure 1 for details on cluster detection). (c) Experimental results from DNA origami structures imaged using a single imager strand species show four distinguishable populations in good agreement with in silico data from c (see Supplementary Figure 5 for details on cluster detection). (d) Exemplary overview DNA-PAINT image of the four DNA origami structures (top). Same data set, now color-coded according to identified clusters in c (bottom). (e) Exemplary intensity versus time traces from highlighted regions in d representing each of the four unique DNA origami species. (f) Engineering frequency and duration on DNA origami below the diffraction limit. Each corner of the structure is designed to exhibit a unique kinetic fingerprint. Scale bars: 1 μm (d), 500 nm (f, top), 40 nm (f, bottom). For details regarding simulation parameters and cluster identification, see Methods in Supporting Information.
Figure 2
Figure 2
Engineered binding kinetics allow simultaneous multiplexed super-resolution imaging of RNA and proteins in cells. (a) Scheme showing the implementation of frequency barcoding for smRNA-FISH. Two distinct RNA species (TFRC and MKI67) are labeled with FISH probes featuring 40 binding sites for DNA-PAINT or 120 binding sites, respectively. (b) Resulting DNA-PAINT data after image acquisition shows TFRC and MKI67 mRNA molecules as single spots, which are not yet distinguishable. (c) Plotting the blinking frequency for all detected single mRNA molecules shows a clearly distinguishable distribution of a low and a high frequency, corresponding to the FISH probe set for TFRC (yellow) and MKI67 (green), respectively. (d) Distinct frequencies are used to assign a pseudocolor for each RNA species. (e) Scheme showing the implementation of duration barcoding for protein detection. Two distinct protein species are labeled with DNA-conjugated antibodies featuring an 8 and 9 nt binding site for DNA-PAINT imaging. (f) Resulting DNA-PAINT data after image acquisition shows CHC and PMP70 proteins as clusters, which are not yet distinguishable. (g) Plotting the binding duration for selected protein locations shows a clearly distinguishable distribution of short and long binding species, corresponding to the two proteins. (h) Distinct durations are used to assign a pseudocolor for each protein species. Scale bars: 1 μm.
Figure 3
Figure 3
Frequency-based 124-plex super-resolution imaging. (a) DNA origami structures are extended with three unique sequences (red, green, or blue) with 0, 3, 9, 22, or 44 copies, respectively. Using combinatorial labeling, this yields a total of 53 – 1 = 124 unique target structures, achieved by distinguishing five frequency levels and using three spectral colors (i.e., three imager strand species). (b) Binding frequency distribution for all 124 DNA origami structures show four clearly distinguishable frequency levels corresponding to 3, 9, 22, and 44 binding sites for each spectral color (red, green, and blue), respectively. Based on these distributions, a unique barcode ID from a pool of 124 can be assigned to each structure. (c) DNA-PAINT super-resolution image of all 124 DNA origami structures, color-coded according to the assigned binding frequency and spectral color. (d) Quantification of the 124-plex experiment shows that all 124 structures could be identified. In total, 3289 structures were quantified, from which 243 were discarded due to ambiguous frequencies (i.e., overlap of distributions in b). (e) Twenty-five out of 124 structures were imaged in one sample in order to assess identification performance. In total, 1165 structures were quantified, from which 28 were categorized as false-positives (i.e., unexpected) resulting in an accuracy of 97.6%. The ratio between lowest expected and highest unexpected is 20 to 7. Scale bar: 5 μm.

References

    1. Hell S. W.; Sahl S. J.; Bates M.; Zhuang X. W.; Heintzmann R.; Booth M. J.; Bewersdorf J.; Shtengel G.; Hess H.; Tinnefeld P.; Honigmann A.; Jakobs S.; Testa I.; Cognet L.; Lounis B.; Ewers H.; Davis S. J.; Eggeling C.; Klenerman D.; Willig K. I.; Vicidomini G.; Castello M.; Diaspro A.; Cordes T. The 2015 super-resolution microscopy roadmap. J. Phys. D: Appl. Phys. 2015, 48 (44), 443001.10.1088/0022-3727/48/44/443001. - DOI
    1. Kanchanawong P.; Shtengel G.; Pasapera A. M.; Ramko E. B.; Davidson M. W.; Hess H. F.; Waterman C. M. Nanoscale architecture of integrin-based cell adhesions. Nature 2010, 468 (7323), 580–4. 10.1038/nature09621. - DOI - PMC - PubMed
    1. Xu K.; Zhong G.; Zhuang X. Actin, spectrin, and associated proteins form a periodic cytoskeletal structure in axons. Science 2013, 339 (6118), 452–6. 10.1126/science.1232251. - DOI - PMC - PubMed
    1. Sahl S. J.; Hell S. W.; Jakobs S. Fluorescence nanoscopy in cell biology. Nat. Rev. Mol. Cell Biol. 2017, 18 (11), 685–701. 10.1038/nrm.2017.71. - DOI - PubMed
    1. Dai M. J.; Jungmann R.; Yin P. Optical imaging of individual biomolecules in densely packed clusters. Nat. Nanotechnol. 2016, 11 (9), 798–807. 10.1038/nnano.2016.95. - DOI - PMC - PubMed

Publication types