Comparative Study
. 2019 May 1;316(5):F1078-F1089.
doi: 10.1152/ajprenal.00615.2018. Epub 2019 Mar 13.

Prompt apoptotic response to high glucose in SGLT-expressing renal cells

Affiliations
Comparative Study

Prompt apoptotic response to high glucose in SGLT-expressing renal cells

Linnéa M Nilsson et al. Am J Physiol Renal Physiol. .

Abstract

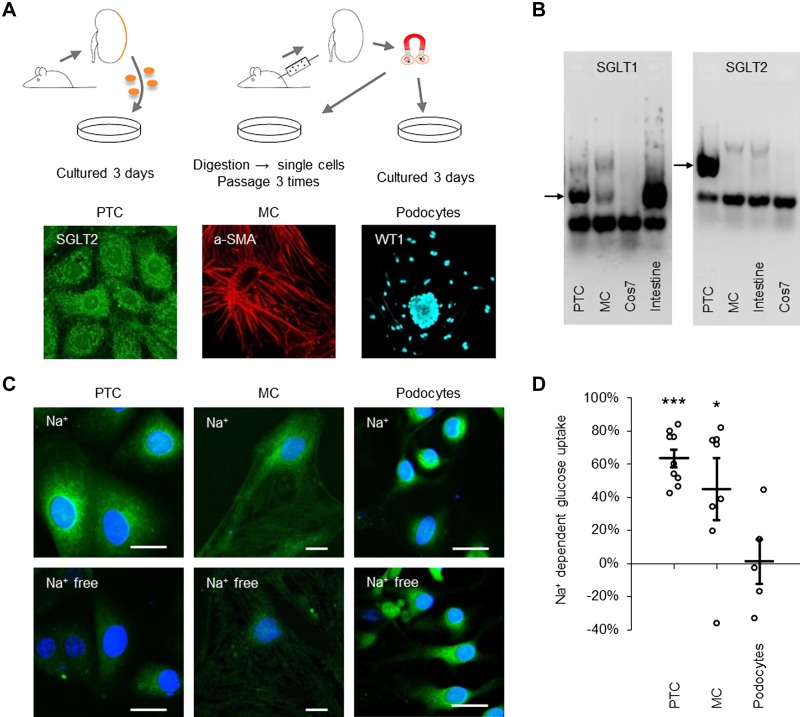
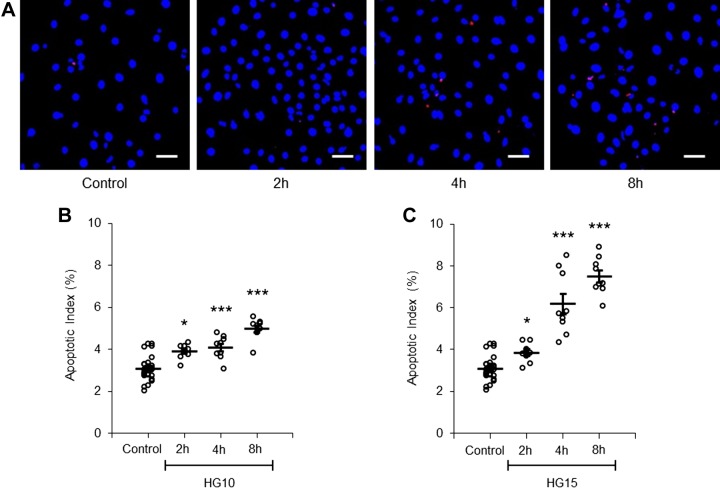
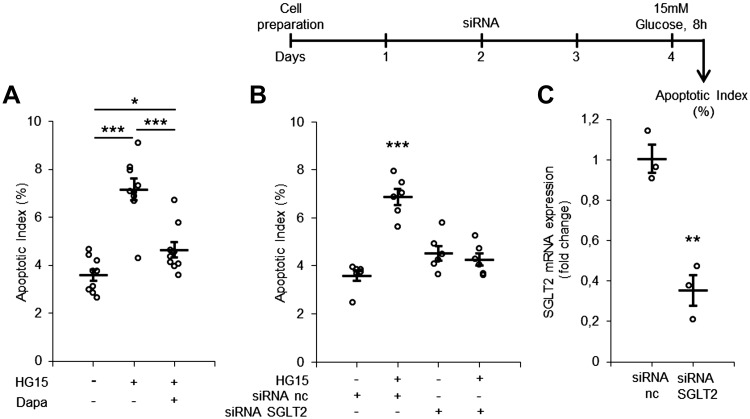
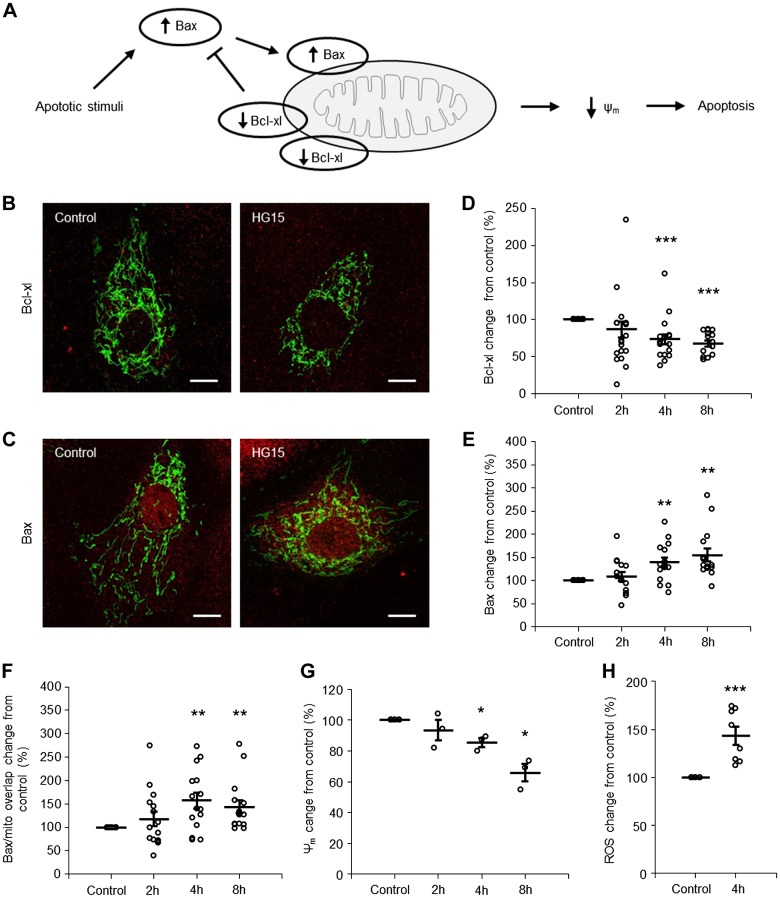
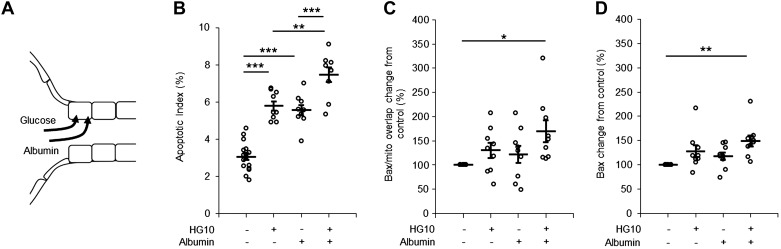
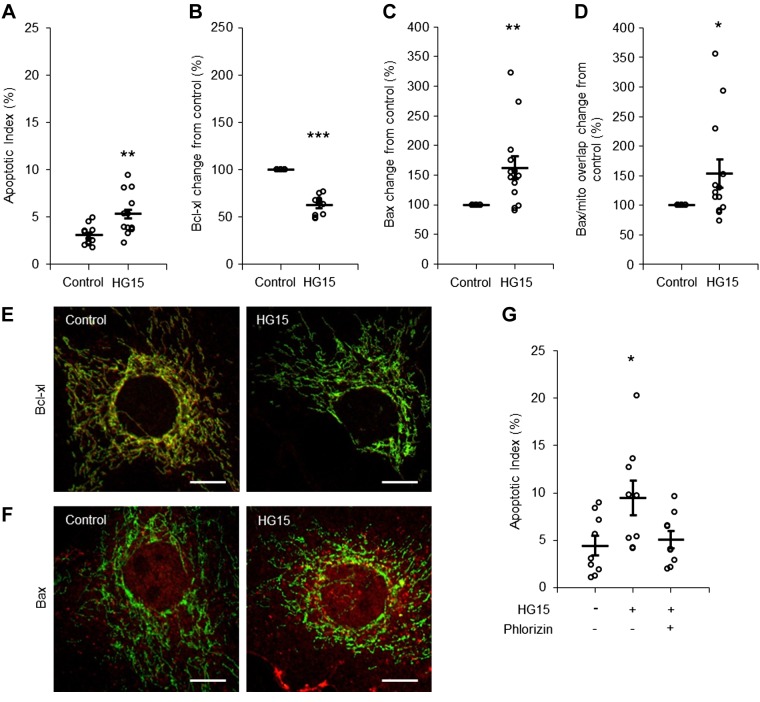
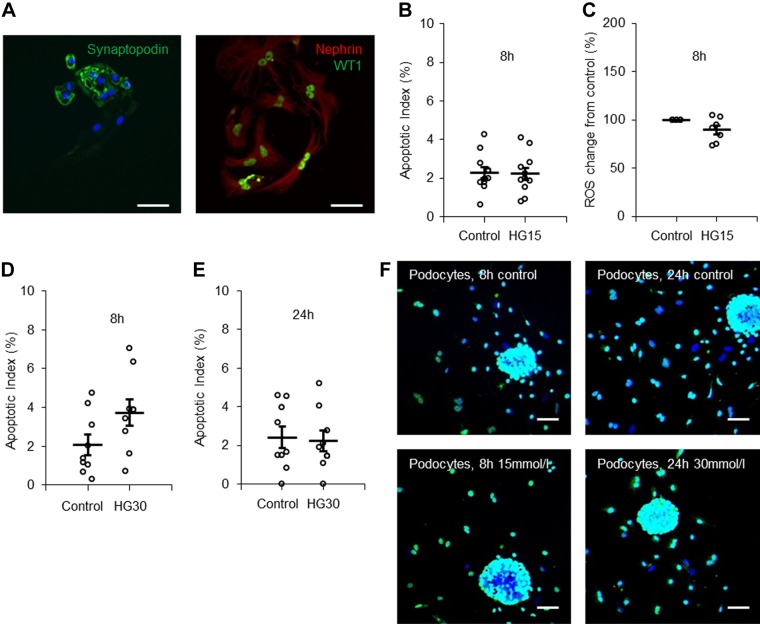
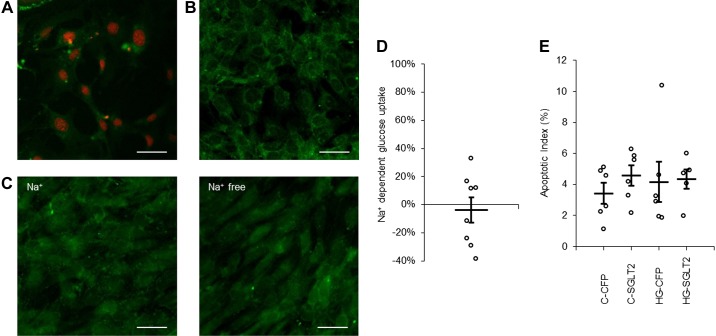
It is generally believed that cells that are unable to downregulate glucose transport are particularly vulnerable to hyperglycemia. Yet, little is known about the relation between expression of glucose transporters and acute toxic effects of high glucose exposure. In the present ex vivo study of rat renal cells, we compared the apoptotic response to a moderate increase in glucose concentration. We studied cell types that commonly are targeted in diabetic kidney disease (DKD): proximal tubule cells, which express Na+-dependent glucose transporter (SGLT)2, mesangial cells, which express SGLT1, and podocytes, which lack SGLT and take up glucose via insulin-dependent glucose transporter 4. Proximal tubule cells and mesangial cells responded within 4-8 h of exposure to 15 mM glucose with translocation of the apoptotic protein Bax to mitochondria and an increased apoptotic index. SGLT downregulation and exposure to SGLT inhibitors abolished the apoptotic response. The onset of overt DKD generally coincides with the onset of albuminuria. Albumin had an additive effect on the apoptotic response. Ouabain, which interferes with the apoptotic onset, rescued from the apoptotic response. Insulin-supplemented podocytes remained resistant to 15 and 30 mM glucose for at least 24 h. Our study points to a previously unappreciated role of SGLT-dependent glucose uptake as a risk factor for diabetic complications and highlights the importance of therapeutic approaches that specifically target the different cell types in DKD.

Keywords: apoptosis; hyperglycemia; podocytes; proximal tubular cells; sodium-dependent glucose transporter.


Conflict of interest statement

No conflicts of interest, financial or otherwise, are declared by the authors.

Figures

Fig. 1.
Fig. 1.
Cell preparation and documentation of Na+-dependent glucose transporter (SGLT) expression in proximal tubule cells (PTCs) and mesangial cells (MCs). A: PTCs (left) were prepared by digesting the outer cortex (150 µm) of rat kidneys into single cells, with cells allowed to culture for 2–3 days before being characterized with SGLT2 antibodies. MCs (middle) were prepared by perfusing rats with magnetic beads, extracting glomeruli-containing beads with a magnetic collector, and digesting glomeruli to single cells. Next, passage 3 MCs were characterized with α-smooth muscle actin (α-SMA) antibodies. Podocytes (right) were prepared from extracted glomeruli as for MCs. Glomeruli were plated for 3 days, letting podocytes move out from the glomerulus. Podocytes were characterized with Wilms tumor 1 (WT1) antibodies. B: PCR for SGLT1 (left) and SGLT2 (right) in PTCs, MCs, Cos7, and intestine tissue, as indicated. Arrows show bands at 199 bp for SGLT1 and 377 bp for SGLT2. C: glucose uptake in PTCs (left), MCs (middle), and podocytes (right) measured with 2-[N-(7-nitrobenz-2-oxa-1,3-diazol-4-yl)amino]-2-deoxyglucose (green) in Na+ (top) or Na+-free (bottom) buffer (5.6 mM glucose). Cells were counterstained with NucBlue (blue). Scale bars = 20 µm. D: quantification of Na+-dependent glucose uptake in PTCs, MCs, and podocytes. Data are expressed as means ± SE; n = 9 coverslips for PTCs and n = 8 coverslips for MCs from 3 individual cell preparations and n = 5 coverslips from 2 individual cell preparations for podocytes. *P < 0.05; ***P < 0.001.
Fig. 2.
Fig. 2.
Short-time apoptotic response of proximal tubule cells (PTCs) to increased glucose concentration. A: PTCs were stained with TUNEL (red) and DAPI (blue). PTCs were incubated with control (5.6 mM) or 15 mM glucose-containing medium for 2, 4, and 8 h. Scale bars = 40 µm. B and C: quantification of the apoptotic index in PTCs incubated with control or with 10 mM (B; HG10) or 15 mM (C; HG15) glucose-containing medium for 2, 4, and 8 h. Approximately 100–200 cells in 5 separate areas of each coverslip were counted. Data are expressed as means ± SE; n = 9 coverslips from 3 individual cell preparations. *P < 0.05; ***P < 0.001.
Fig. 3.
Fig. 3.
Na+-dependent glucose transporter (SGLT2) inhibition with dapagliflozin or knockdown with siRNA protects from high glucose-induced apoptosis in proximal tubule cell (PTCs). A: quantification of the apoptotic index in PTCs incubated with control (5.6 mM), 15 mM glucose (HG15)-containing, or 15 mM glucose + 1 µM dapagliflozin (Dapa)-containing medium for 8 h. Dapagliflozin was dissolved in DMSO; an equal amount DMSO was added to all samples as a control. Data are expressed as means ± SE; n = 9 coverslips from 3 individual cell preparations. B: timeline for siRNA silencing (top) and quantification of the apoptotic index in PTCs transfected with SGLT2 or negative control (nc) siRNA for 48 h and incubated with control or 15 mM glucose for 8 h (bottom). Data are expressed as mean ± SE; n = 6 coverslips from 2 individual cell preparations. C: quantification of SGLT2 mRNA expression after siRNA exposure for 48 h. Data are expressed as means ± SE; n = 3 cell preparations. **P < 0.01; ***P < 0.001.
Fig. 4.
Fig. 4.
High glucose triggers apoptosis via the mitochondrial pathway in a time-dependent manner in proximal tubule cell (PTCs). A: cartoon illustrating activation of the mitochondrial apoptotic pathway. Under normal conditions, there is a balance between Bcl-xL and Bax, preventing apoptosis. When an apoptotic stimulus, i.e., high glucose, activates the intrinsic apoptotic pathway, the balance between Bax and Bcl-xL is disrupted, which leads to mitochondrial dysfunction [decreased mitochondrial membrane potential (Δψm)] and apoptosis. B and C: immunofluorescence staining for Bcl-xL (B) and Bax (C) expression (red) in PTCs incubated with control (5.6 mM) or 15 mM glucose (HG15)-containing medium for 8 h. Mitochondria are shown in green. Scale bars = 10 µm. D−F: quantification of Bcl-xL abundance (D), Bax abundance (E), and Bax accumulation on mitochondria (F) in PTCs incubated with control or 15 mM glucose-containing medium for 2, 4, and 8 h. Data are expressed as means ± SE; n = 15 coverslips from 5 individual cell preparations. G: quantification of Δψm in PTCs incubated with control or 15 mM glucose-containing medium for 2, 4, and 8 h. Data are expressed as means ± SE; n = 3 coverslips from 3 individual cell preparations. H: quantification of ROS in PTCs incubated with control or 15 mM glucose-containing medium for 4 h. Data are expressed as means ± SE; n = 8 coverslips from 2 individual cell preparations. *P < 0.05; **P < 0.01; ***P < 0.001.
Fig. 5.
Fig. 5.
Short-time apoptotic response of proximal tubule cells (PTCs) coincubated with high glucose and albumin. A: cartoon illustrating the uptake of high glucose (red arrow) and albumin (purple arrow) in PTCs. B−D: quantification of the apoptotic index (B), Bax abundance (C), and Bax accumulation on mitochondria (D) in PTCs incubated with control (5.6 mM), 10 mM glucose (HG10)-, 2.5 mg/ml albumin-, or 10 mM glucose + 2.5 mg/ml albumin-containing medium for 8 h. Data are expressed as means ± SE; n = 9 coverslips from 3 individual cell preparations. *P < 0.05; **P < 0.01; ***P < 0.001.
Fig. 6.
Fig. 6.
Short-time apoptotic response of mesangial cells (MCs) to an increased glucose concentration. A−D: quantification of the apoptotic index (AI; A), Bcl-xL abundance (B), Bax abundance (C), and Bax accumulation on mitochondria (D) in MCs incubated with control (5.6 mM) or 15 mM glucose (HG15)-containing medium for 8 h. n = 12 coverslips from 4 individual cell preparations for the AI and Bcl-xL and n = 13 coverslips from 5 individual cell preparations for Bax. E and F: immunofluorescence staining for Bcl-xL (E) and Bax (F) expression (red) in MCs incubated with control or 15 mM glucose-containing medium for 8 h. Mitochondria are shown in green. Scale bars = 10 µm. G: quantification of the AI in MCs incubated with control, 15 mM glucose-, or 15 mM glucose + 0.2 mM phlorizin-containing medium for 8 h. Phlorizin was dissolved in DMSO, and an equal amount DMSO was added to all samples as a control. Data are expressed as means ± SE; n = 9 coverslips from 3 individual cell preparations. *P < 0.05; **P < 0.01; ***P < 0.001.
Fig. 7.
Fig. 7.
Primary podocytes do not exhibit a short-time apoptotic response to increased glucose concentration. A: immunostaining for podocyte-specific markers in primary podocytes. Left, synaptopodin (green) and DAPI (blue); right, nephrin (red) and Wilms tumor 1 (WT1; green). Scale bars = 10 µm. B: quantification of the apoptotic index in podocytes incubated with control (5.6 mM) or 15 mM glucose (HG15)-containing medium for 8 h. n = 12 coverslips from 4 individual cell preparations. C: quantification of ROS production in podocytes incubated with control or 15 mM glucose-containing medium for 8 h. n = 8 coverslips from 2 individual cell preparations. D and E: quantification of the apoptotic index in podocytes incubated with control or 30 mM glucose-containing medium for 8 h (D) or 24 h (E). n = 12 coverslips from 4 individual cell preparations. F: podocytes stained with TUNEL (red), WT1 (green), and DAPI (blue). Podocytes were incubated with control, 15 mM glucose, or 30 mM glucose (HG30) for 8 or 24 h as indicated. Scale bars = 40 µm. Data are expressed as means ± SE.
Fig. 8.
Fig. 8.
Immortalized podocytes transfected with Na+-dependent glucose transporter (SGLT)2 do not have Na+-dependent glucose uptake or increased apoptosis. A: immortalized podocytes transfected with SGLT2-ires-cyan fluorescent protein (CFP) (green). Nuclei were counterstained with DRAQ5 (red). Scale bar = 40 µm. B: immunostaining for SGLT2 (green) in immortalized podocytes transfected with SGLT2. Scale bar = 40 µm. C: glucose uptake in immortalized podocytes measured with 2-[N-(7-nitrobenz-2-oxa-1,3-diazol-4-yl)amino]-2-deoxyglucose (green) in Na+ or Na+-free buffer (5.6 mM glucose). Scale bars = 40 µm. D: quantification of Na+-dependent glucose uptake in immortalized podocytes. n = 8 coverslips. E: quantification of the apoptotic index of immortalized podocytes transfected with empty vector CFP or SGLT2 and incubated with control (C; 5.6 mM) or 15 mM glucose (HG)-containing medium for 8 h. Data are expressed as means ± SE; n = 6 coverslips.

References

    1. Abrass CK. Diabetic nephropathy. Mechanisms of mesangial matrix expansion. West J Med 162: 318–321, 1995. - PMC - PubMed
    1. Aperia A, Akkuratov EE, Fontana JM, Brismar H. Na+-K+-ATPase, a new class of plasma membrane receptors. Am J Physiol Cell Physiol 310: C491–C495, 2016. doi:10.1152/ajpcell.00359.2015. - DOI - PubMed
    1. Aperia A, Larsson L, Zetterström R. Hormonal induction of Na-K-ATPase in developing proximal tubular cells. Am J Physiol Renal Physiol 241: F356–F360, 1981. doi:10.1152/ajprenal.1981.241.4.F356. - DOI - PubMed
    1. Banerjee SK, McGaffin KR, Pastor-Soler NM, Ahmad F. SGLT1 is a novel cardiac glucose transporter that is perturbed in disease states. Cardiovasc Res 84: 111–118, 2009. doi:10.1093/cvr/cvp190. - DOI - PMC - PubMed
    1. Bonner C, Kerr-Conte J, Gmyr V, Queniat G, Moerman E, Thévenet J, Beaucamps C, Delalleau N, Popescu I, Malaisse WJ, Sener A, Deprez B, Abderrahmani A, Staels B, Pattou F. Inhibition of the glucose transporter SGLT2 with dapagliflozin in pancreatic alpha cells triggers glucagon secretion. Nat Med 21: 512–517, 2015. doi:10.1038/nm.3828. - DOI - PubMed

Publication types

MeSH terms