. 2019 Mar 13:8:e43464.
doi: 10.7554/eLife.43464.

Empirical examination of the replicability of associations between brain structure and psychological variables

Affiliations

Empirical examination of the replicability of associations between brain structure and psychological variables

Shahrzad Kharabian Masouleh et al. Elife. .

Abstract

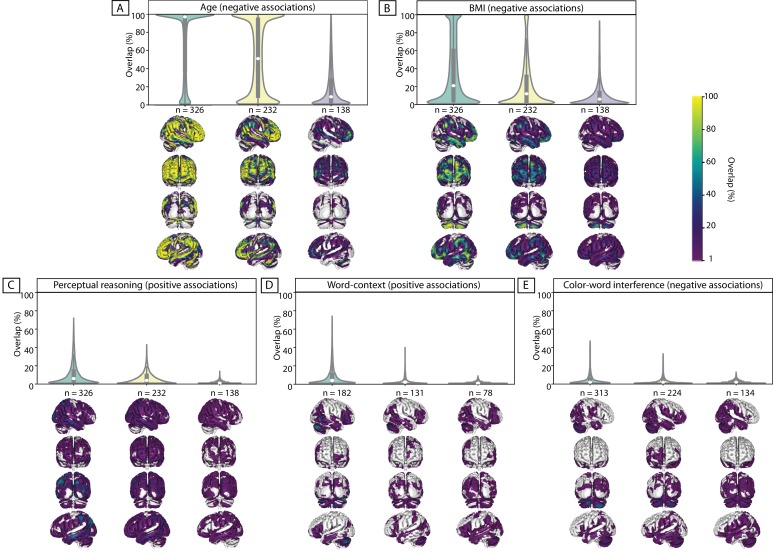
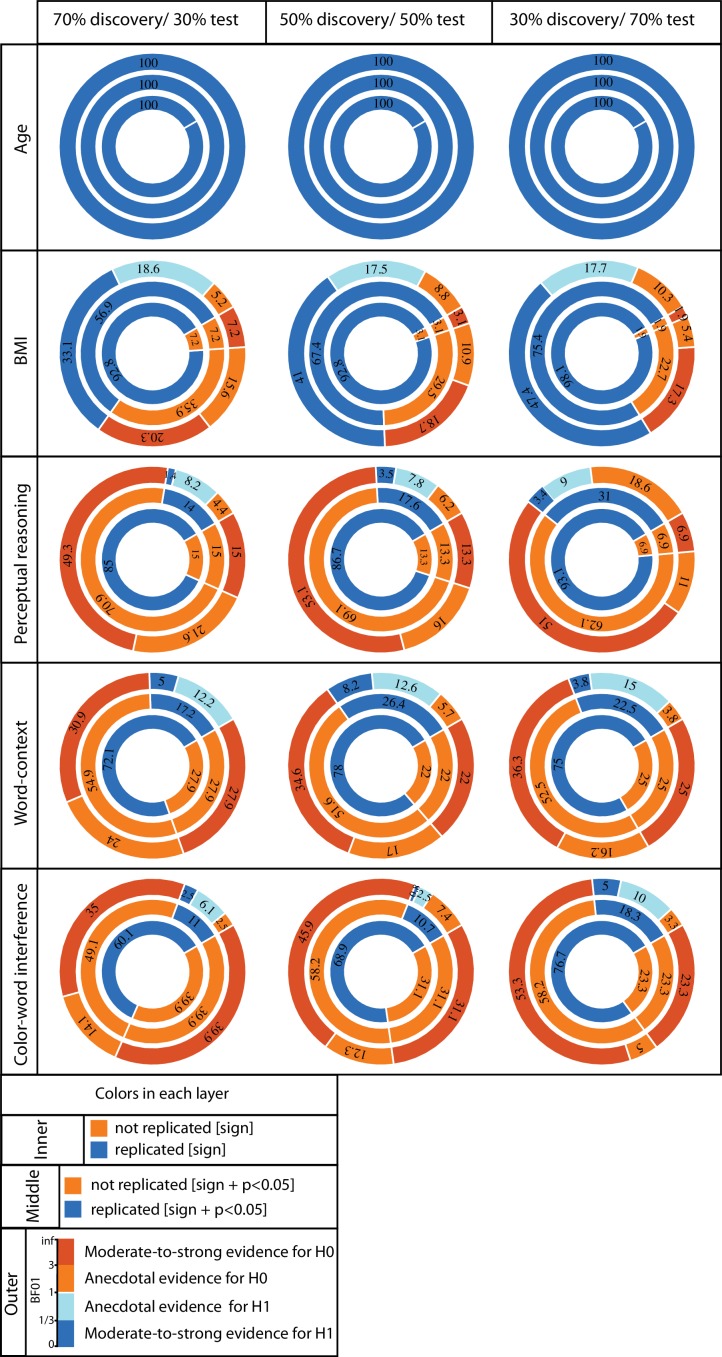
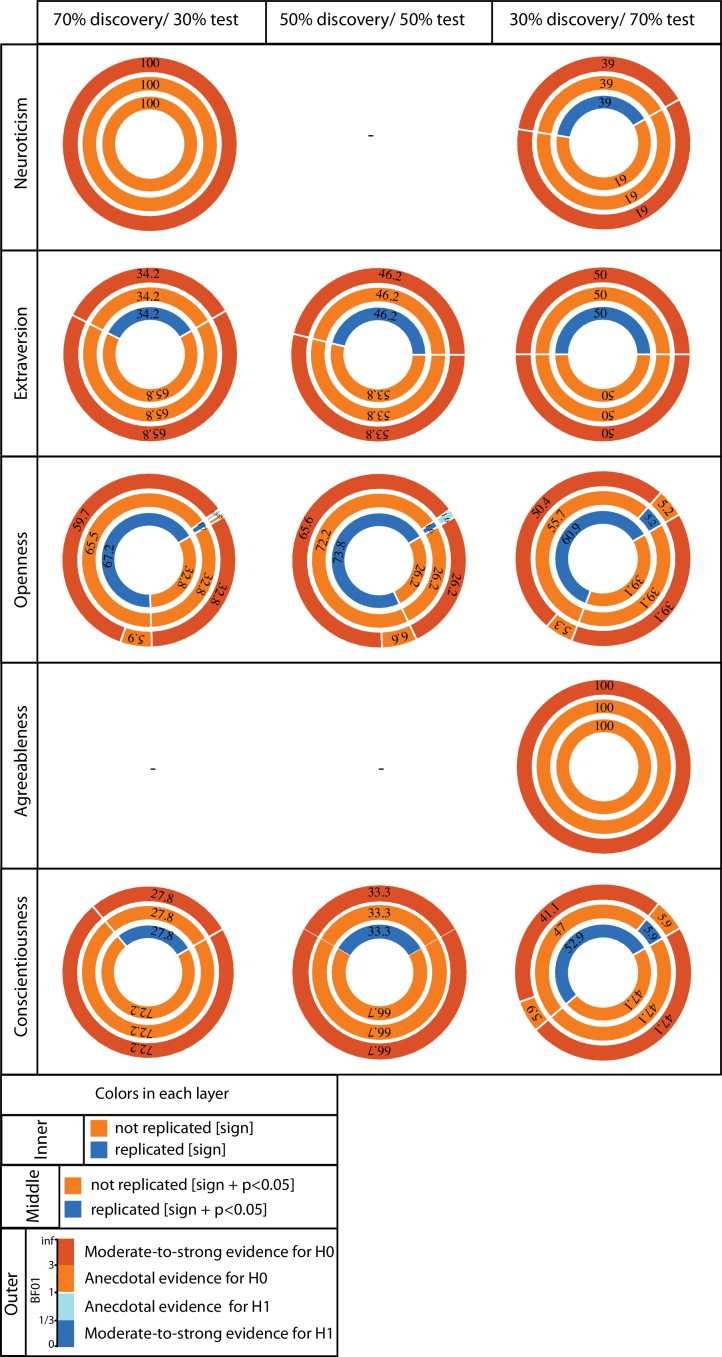
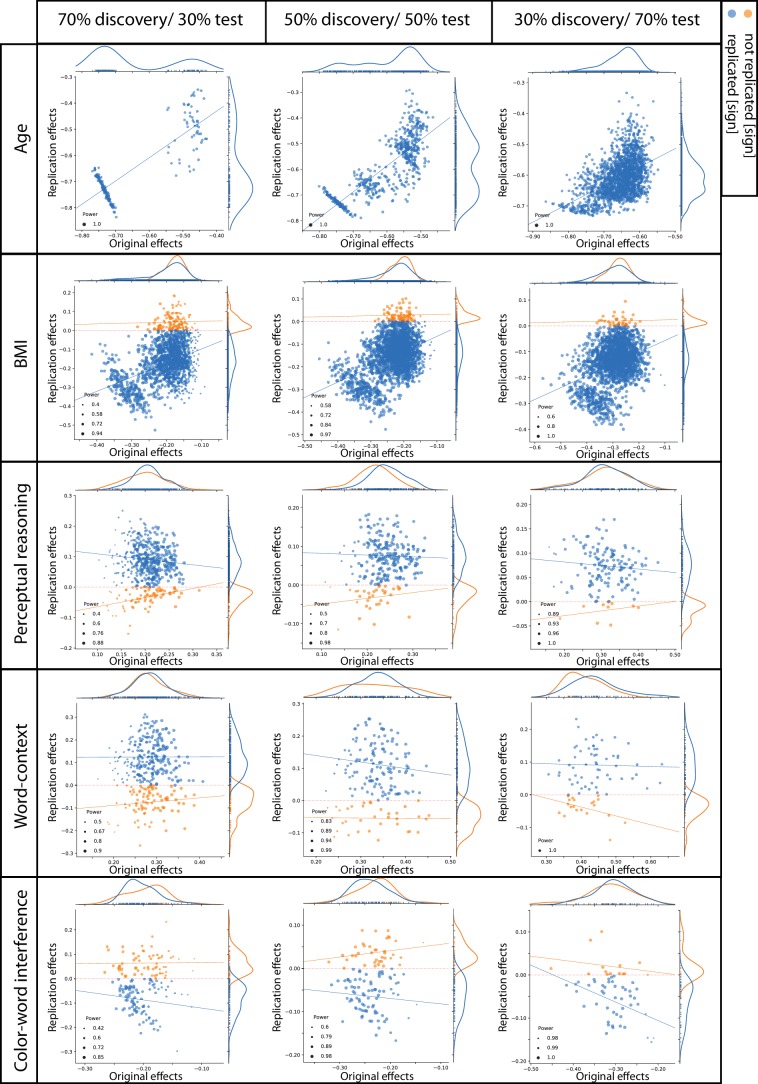
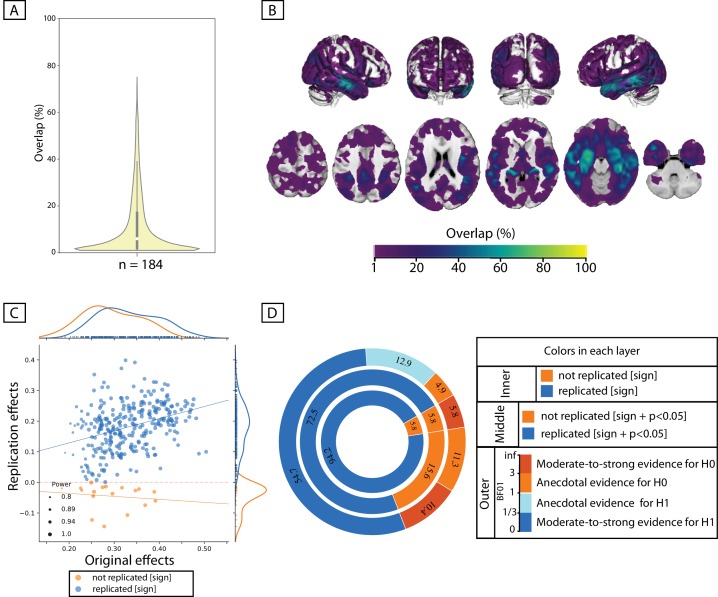
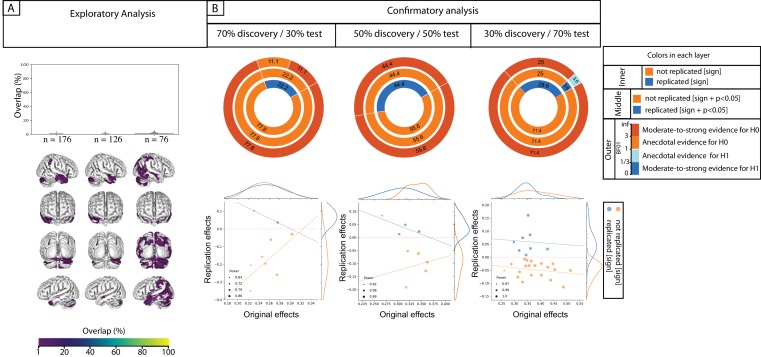
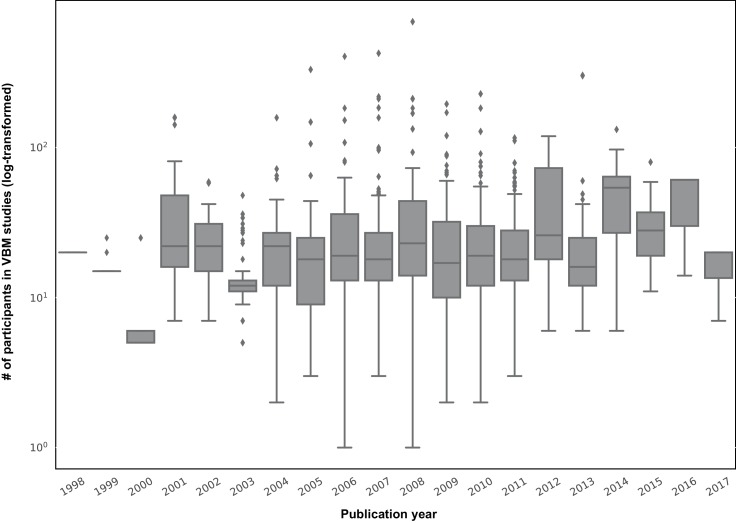
Linking interindividual differences in psychological phenotype to variations in brain structure is an old dream for psychology and a crucial question for cognitive neurosciences. Yet, replicability of the previously-reported 'structural brain behavior' (SBB)-associations has been questioned, recently. Here, we conducted an empirical investigation, assessing replicability of SBB among heathy adults. For a wide range of psychological measures, the replicability of associations with gray matter volume was assessed. Our results revealed that among healthy individuals 1) finding an association between performance at standard psychological tests and brain morphology is relatively unlikely 2) significant associations, found using an exploratory approach, have overestimated effect sizes and 3) can hardly be replicated in an independent sample. After considering factors such as sample size and comparing our findings with more replicable SBB-associations in a clinical cohort and replicable associations between brain structure and non-psychological phenotype, we discuss the potential causes and consequences of these findings.

Keywords: brain morphometry; human; inter-individual differences; neuroscience; psychometry; replication; structural brain-behavior associations.


Conflict of interest statement

SK, SE, FH, SG No competing interests declared

Figures

Figure 1.
Figure 1.. Replicability of exploratory results within healthy cohort.
Frequency of spatial overlap (density plots and aggregate maps) of significant findings from exploratory analysis over 100 random subsamples are depicted for few behavioral score. For each score, columns show the results of three different discovery sample sizes (i.e. when discovery cohorts are generated from 70%, 50% or 30% of the main sample, from left to right respectively (x-axis)). The density plots show the distribution of values within their corresponding aggregate map. The y-axis depicts the frequency of spatial overlap (in %) and the density plots show the distribution of values within their corresponding aggregate maps. In addition to age and BMI (A,B), which are used as benchmarks, the top three behavioral scores with the highest frequency of overlapping findings are depicted (C–E). Within each density plot, the box-plot shows the quartiles and extent of the distribution and the white dot depicts the median of percentage of overlap. On the spatial maps, lighter colors denote higher number of samples with a significant association at the respective voxel. BMI: body mass index; CWI: color-word interference; n = number of participants within the discovery samples.
Figure 2.
Figure 2.. ROI-based confirmatory replication results within healthy cohort.
Donut plots summerising ROI-based replication rates (% of ROI) using three different critera for three different sample sizes among heathy participants. The most inner layers depict replication using ‘sign’ only (blue: replicated, orange: not replciated). The middle layers define replication based on similar ‘sign’ as well as ‘statistical significance’ (i.e. p<0.05) (blue: replicated, orange: not replciate). The most outer layers define replication using ‘bayes factor’ (blue: “moderate-to-string evidece for H1, light blue: anecdotal evidence for H1; light orange: anecdotal evidence for H0, orange: “moderate-to-string evidece for H0).
Figure 2—figure supplement 1.
Figure 2—figure supplement 1.. ROI-based confirmatory replication results for five personality subscores within healthy cohort.
Donut plots summerising ROI-based replication rates (% of ROI) using three different critera for three different sample sizes among heathy participants. The most inner layers depict replication using ‘sign’ only (blue: replicated, orange: not replciated). The middle layers define replication based on similar ‘sign’ as well as ‘statistical significance’ (i.e. p<0.05) (blue: replicated, orange: not replciate). The most outer layers define replication using ‘bayes factor’ (blue: “moderate-to-string evidece for H1, light blue: anecdotal evidence for H1; light orange: anecdotal evidence for H0, orange: “moderate-to-string evidece for H0).
Figure 3.
Figure 3.. Discovery versus replication effects sizes: Scatter plots of correlation coefficients in the discovery versus replication sample for all ROIs from 100 splits within healthy cohort; each point denotes one ROI, which is color-coded based on its replication status (by-‘sign’).
The size of each point is proportional to its estimated statistical power of replication. Regresion lines are drawn for the replicated and unreplicated ROIs, separately.
Figure 4.
Figure 4.. Replicability of positive association between immediate-recall and GMV within ADNI cohort.
(A, B) Replicability of exploratory results: Frequency of spatial overlaps (density plot and aggregate maps) over 100 random subsamples. Within the density plot, the box-plot shows the quartiles and extent of the distribution and the white dot depicts the median of percentage of overlap. (C, D) ROI-based confirmatory replication results: C: Original versus replication effects sizes (correlation coefficient) for all ROIs from 100 splits; points are color-coded based on their replciation status (by-‘sign’) and size of each point is proportional to the estimated statistical power of replication. Regresion lines are drawn for the replicated and unreplicated ROIs, separately. D: Donut plots summerising ROI-based replicability rates using three different critera. The most inner layer depicts replicability using ‘sign’ only (blue: replicated, orange: not replciated). The middle layer, defines replication based on similar ‘sign’ as well as ‘statistical significance’ (i.e. p<0.05) (blue: replicated, orange: not replciate). The most outer layer reflects replicability using bayes factor’ (blue: 'moderate-to-string evidece for H1, light blue: anecdotal evidence for H1; light orange: anecdotal evidence for H0, orange: 'moderate-to-string evidece for H0); Discovery and replication samples have equal size (n = 184) and are matched for age, sex and site.
Figure 4—figure supplement 1.
Figure 4—figure supplement 1.. Summary of replication of positive associations between immediate-recall and GMV within healthy cohort.
(A) Frequency of spatial overlap (density plots and aggregate maps) of significant findings from exploratory analysis over 100 random subsamples. Columns show results of three different discovery sample sizes (i.e. when discovery cohorts are generated from 70%, 50% or 30% of the main sample, from left to right respectively (x-axis)). The density plots show distribution of values within their corresponding aggregate map. The y-axis depicts frequency of spatial overlap (in %) and the density plots show distribution of values within their corresponding aggregate map. On the spatial maps, warmer colors denote higher number of samples with a significant association at the respective voxel. (B) ROI-based confirmatory replication results: Top row: Donut plots summerising ROI-based replicability rates (% of ROI) using three different critera for three different sample sizes. The most inner layers depict replicability using ‘sign’ only (blue: replicated, orange: not replciated). The middle layers define replication based on similar ‘sign’ as well as ‘statistical significance’ (i.e. p<0.05) (blue: replicated, orange: not replciate). The most outer layers reflects replicability using bayes factor’ (blue: 'moderate-to-string evidece for H1, light blue: anecdotal evidence for H1; light orange: anecdotal evidence for H0, orange: 'moderate-to-string evidece for H0); Bottom row: Scatter plots of effect sizes (correlation coefficient) in the discovery versus replication sample for all ROIs from 100 splits within healthy cohort; Points are color-coded based on their replciation status (by-‘sign’) and size of each point is proportional to the estimated statistical power of replication. Regresion lines are drawn for the replciated and unreplicated ROIs, separately.
Figure 5.
Figure 5.. box-plots showing distribution of sample sizes (log-scale) of VBM studies by their publication year (data from the BrainMap database; see Vanasse et al., 2018).
Each box shows the quantiles (25% and 75%) of the distribution and the gray horizontal line within each box, depicts the median of the distribution.

Comment in

Similar articles

Cited by

References

    1. Albers C, Lakens D. When power analyses based on pilot data are biased: inaccurate effect size estimators and follow-up bias. Journal of Experimental Social Psychology. 2018;74:187–195. doi: 10.1016/j.jesp.2017.09.004. - DOI
    1. Anderson ML. Précis of after phrenology: neural reuse and the interactive brain. Behavioral and Brain Sciences. 2016;39:e120. doi: 10.1017/S0140525X15000631. - DOI - PubMed
    1. Ashburner J. A fast diffeomorphic image registration algorithm. NeuroImage. 2007;38:95–113. doi: 10.1016/j.neuroimage.2007.07.007. - DOI - PubMed
    1. Ashburner J, Friston KJ. Unified segmentation. NeuroImage. 2005;26:839–851. doi: 10.1016/j.neuroimage.2005.02.018. - DOI - PubMed
    1. Boekel W, Wagenmakers EJ, Belay L, Verhagen J, Brown S, Forstmann BU. A purely confirmatory replication study of structural brain-behavior correlations. Cortex. 2015;66:115–133. doi: 10.1016/j.cortex.2014.11.019. - DOI - PubMed

Publication types