. 2019 May 10;37(14):1217-1227.
doi: 10.1200/JCO.18.01798. Epub 2019 Mar 13.

Mutational Analysis of Patients With Colorectal Cancer in CALGB/SWOG 80405 Identifies New Roles of Microsatellite Instability and Tumor Mutational Burden for Patient Outcome

Affiliations

Mutational Analysis of Patients With Colorectal Cancer in CALGB/SWOG 80405 Identifies New Roles of Microsatellite Instability and Tumor Mutational Burden for Patient Outcome

Federico Innocenti et al. J Clin Oncol. .

Abstract

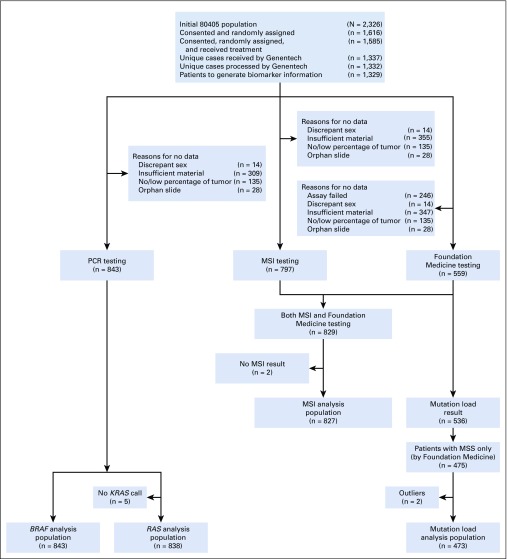
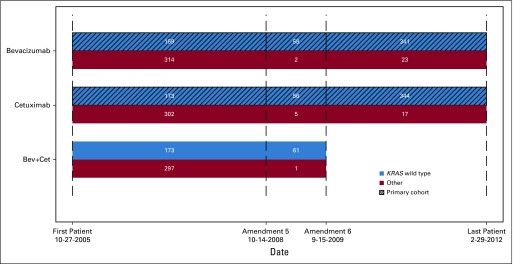
Purpose: CALGB/SWOG 80405 was a randomized phase III trial that found no statistically significant difference in overall survival (OS) in patients with first-line metastatic colorectal cancer treated with chemotherapy plus either bevacizumab or cetuximab. Primary tumor DNA from 843 patients has been used to discover genetic markers of OS.

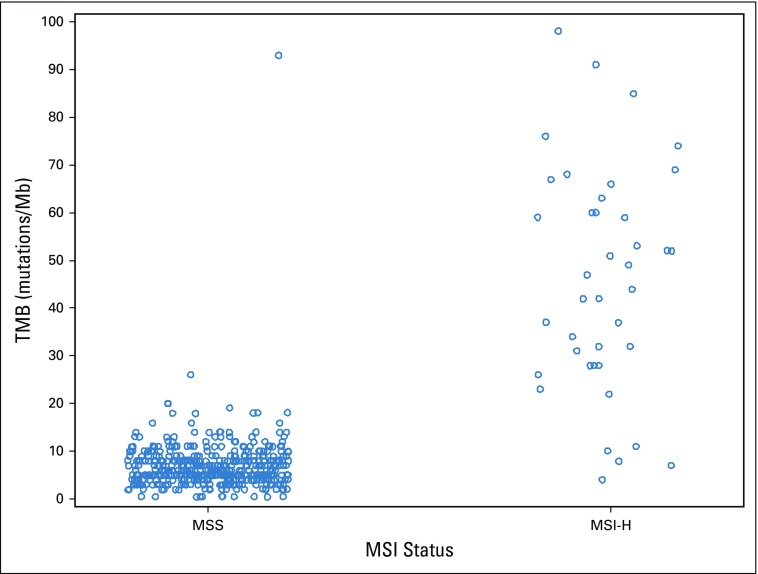
Patients and methods: Gene mutations were determined by polymerase chain reaction. Microsatellite status was determined by genotyping of microsatellites. Tumor mutational burden (TMB) was determined by next-generation sequencing. Cox proportional hazard models were used, with adjusting factors. Interaction of molecular alterations with either the bevacizumab or the cetuximab arms was tested.

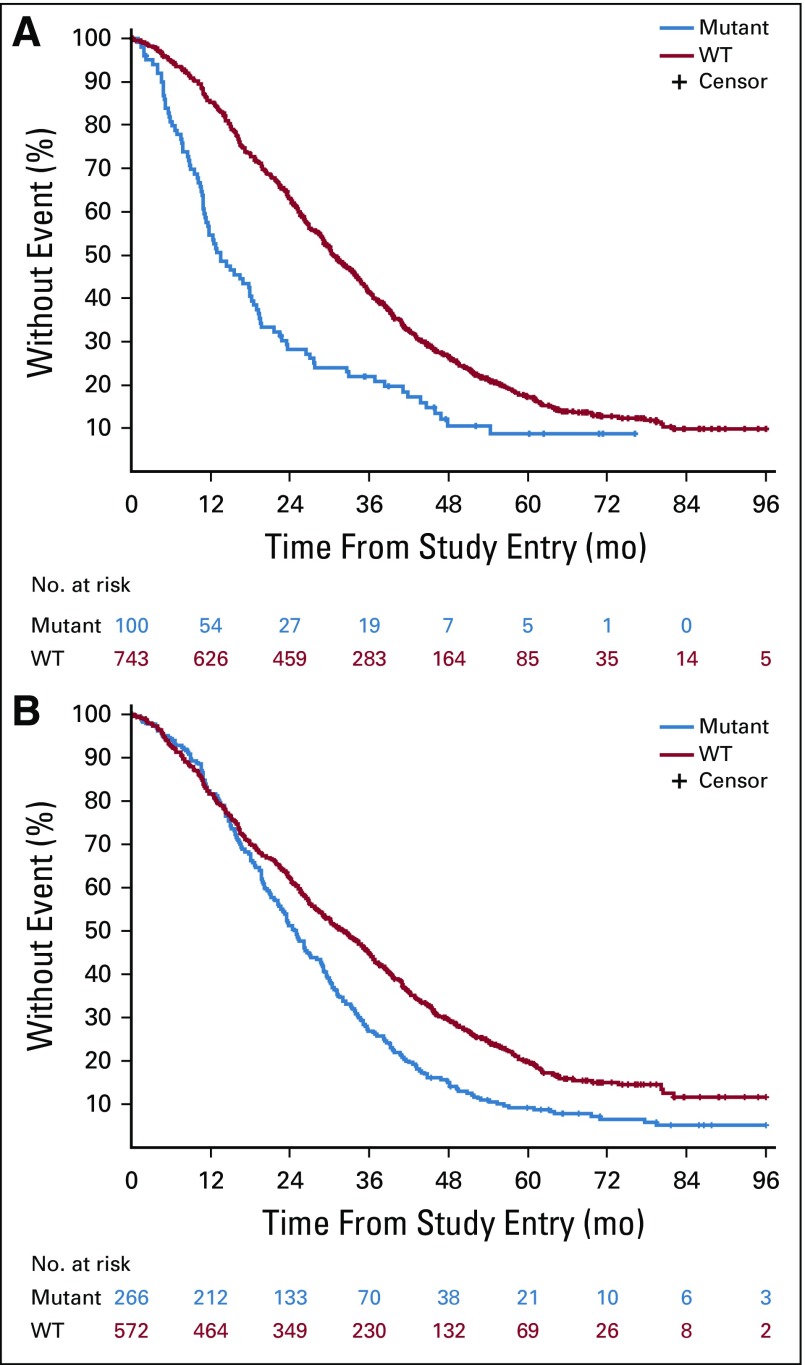
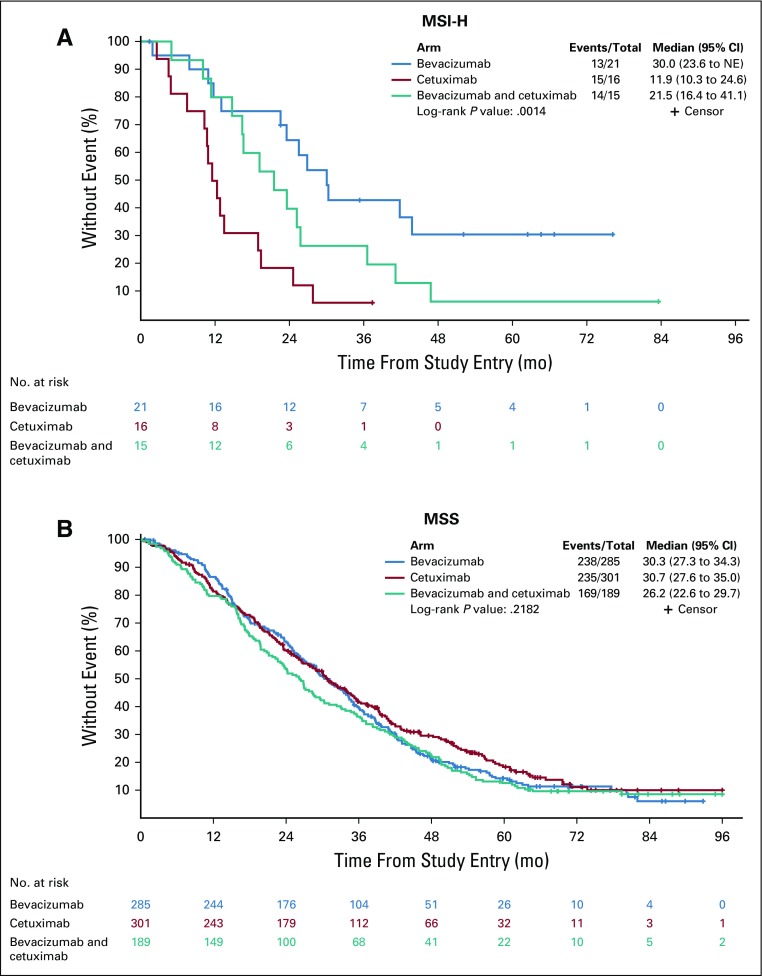
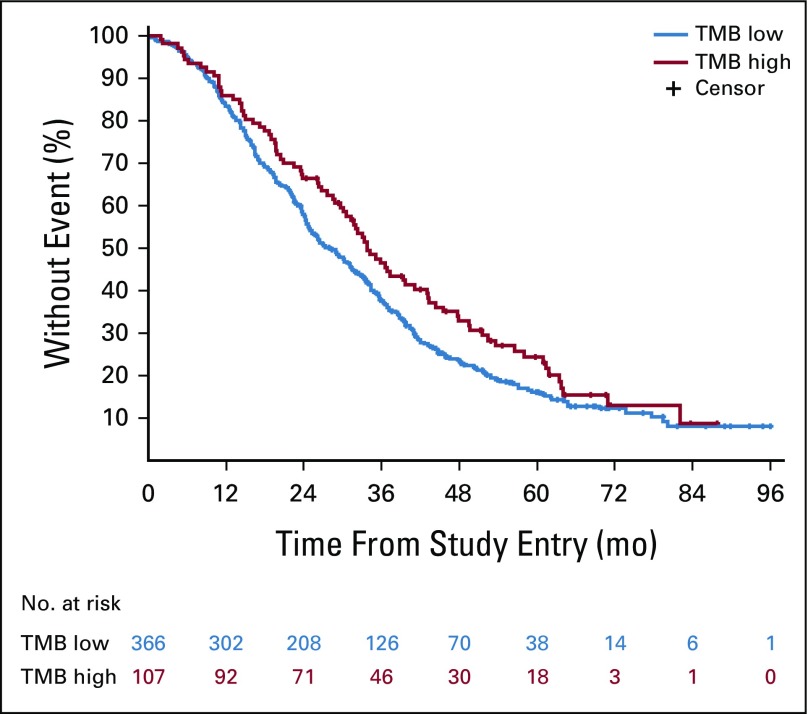
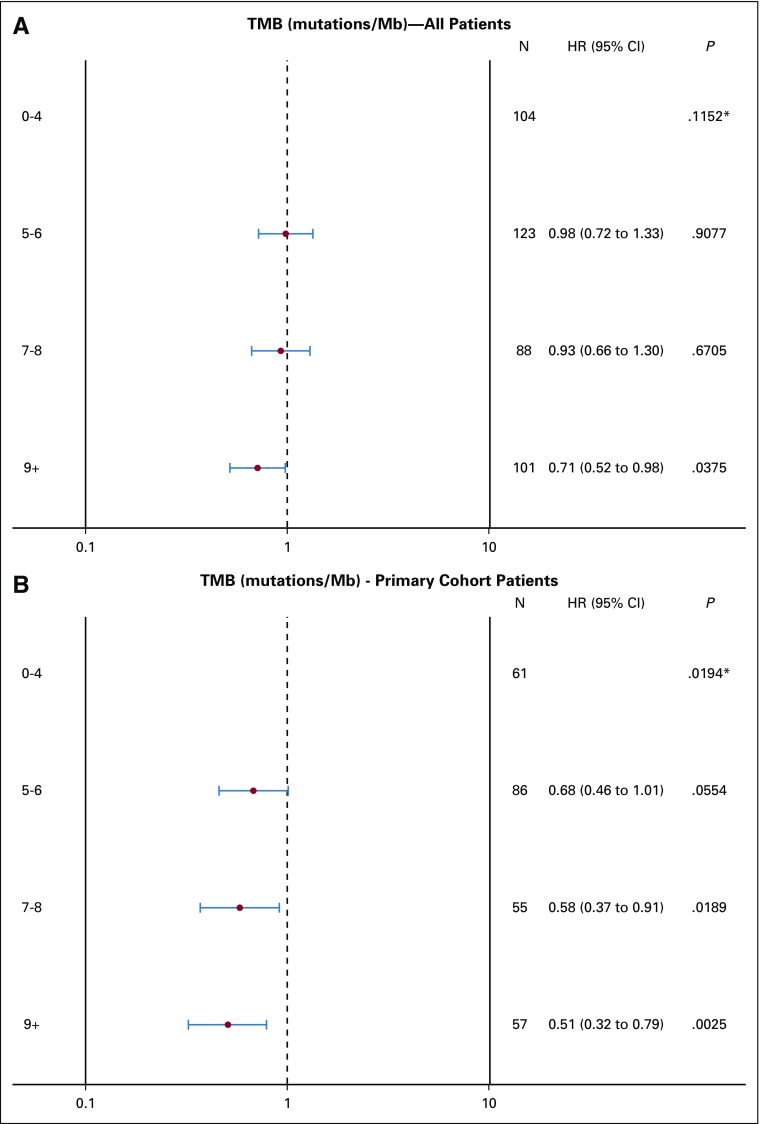
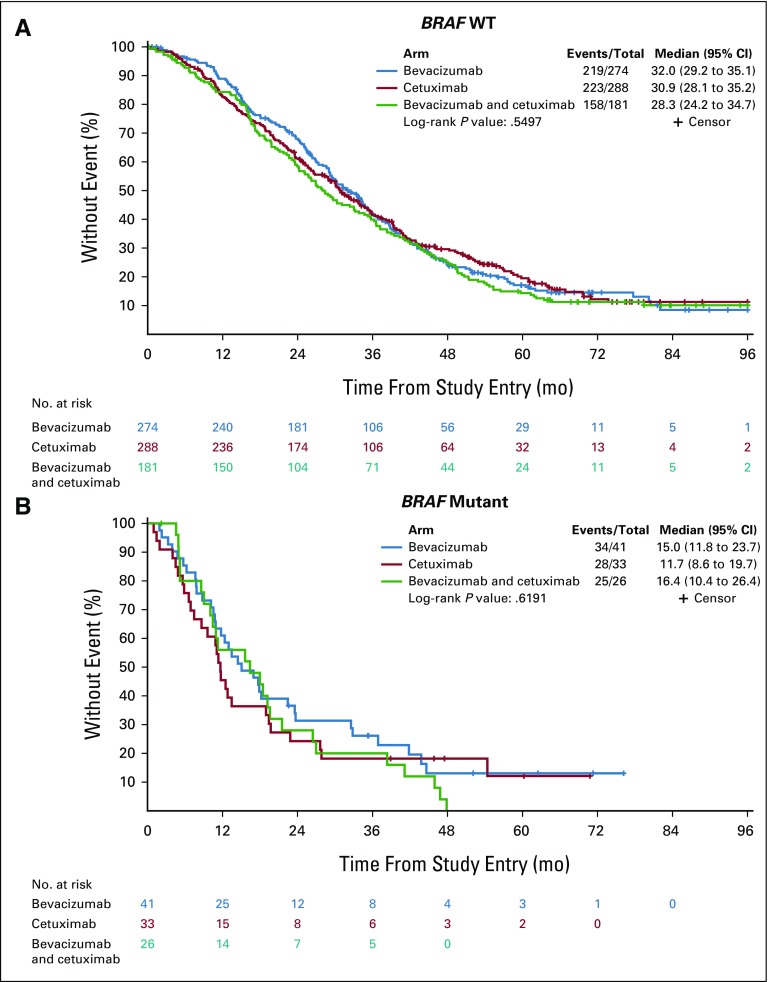
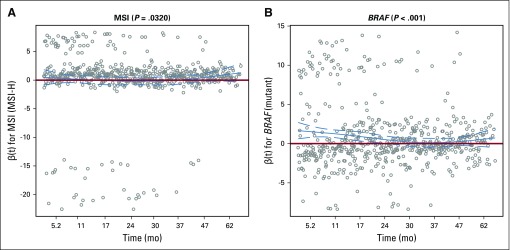
Results: Patients with high TMB in their tumors had longer OS than did patients with low TMB (hazard ratio [HR], 0.73 [95% CI, 0.57 to 0.95]; P = .02). In patients with microsatellite instability-high (MSI-H) tumors, longer OS was observed in the bevacizumab arm than in the cetuximab arm (HR, 0.13 [95% CI, 0.06 to 0.30]; interaction P < .001 for interaction between microsatellite status and the two arms). Patients with BRAF mutant tumors had shorter OS than did patients with wild-type (WT) tumors (HR, 2.01 [95% CI, 1.49 to 2.71]; P < .001). Patients with extended RAS mutant tumors had shorter OS than did patients with WT tumors (HR, 1.52 [95% CI, 1.26 to 1.84]; P < .001). Patients with triple-negative tumors (WT for NRAS/KRAS/BRAF) had a median OS of 35.9 months (95% CI, 33.0 to 38.8 months) versus 22.2 months (95% CI, 19.6 to 24.4 months ) in patients with at least one mutated gene in their tumors (P < .001).

Conclusion: In patients with metastatic colorectal cancer treated in first line, low TMB, and BRAF and RAS mutations are negative prognostic factors. Patients with MSI-H tumors benefited more from bevacizumab than from cetuximab, and studies to confirm this effect of MSI-H are warranted.


Figures

FIG 1.
FIG 1.
CONSORT diagram. MSI, microsatellite instability; MSS, microsatellite stable; PCR, polymerase chain reaction.
FIG 2.
FIG 2.
Kaplan-Meier plots of the effect of BRAF mutations (top) and extended RAS mutations (bottom) on overall survival. Log-rank P values are reported from an unadjusted analysis. The results refer to all patients for whom mutational analysis was available, which includes pre-KRAS amendment and post-KRAS amendment patients. WT, wild type.
FIG 3.
FIG 3.
Kaplan-Meier plots of the effect of microsatellite status on overall survival on the basis of treatment arm (microsatellite instability–high [MSI-H], top; microsatellite stable [MSS], bottom). Log-rank P values are reported from an unadjusted analysis. The results refer to all patients for whom mutational analysis was available, which includes pre-KRAS amendment and post-KRAS amendment patients. The proportions of right and transverse and left tumors in MSI-H tumors are 79.2% and 20.8%, respectively.
FIG 4.
FIG 4.
Kaplan-Meier plots of the effect of tumor mutational burden (TMB) status on overall survival. Log-rank P values are reported from an unadjusted analysis. The results refer to all patients for whom mutational analysis was available, which includes pre-KRAS amendment and post-KRAS amendment patients. In TMB-high tumors, the proportions of right and transverse and left tumors were 45.1% and 54.9%, respectively. In TMB-low tumors, the proportions of right and transverse and left tumors were 40.3% and 59.7%, respectively.
FIG A1.
FIG A1.
Flow chart of patients by arm, KRAS status, and amendments (amendment 5: to enroll only KRAS WT for codon 12/13, amendment 6: to stop the bevacizumab-cetuximab [Bev+Cet] combination arm).
FIG A2.
FIG A2.
Tumor mutational burden (TMB) values by microsatellite instability (MSI) status. One hypermuytated outlier in the microsatellite stable (MSS) group (TMB=361) and one hypermutated outlier in the microsatellite instability–high (MSI-H) group (TMB=208) are not shown in the figure.
FIG A3.
FIG A3.
Inverse correlation between tumor mutational burden (TMB) and hazard ratio (HR) of overall survival (A) in all patients and (B) in the primary cohort patients. (*) A 3-degree-of-freedom test for detecting whether there is any difference in outcome across different TMB levels.
FIG A4.
FIG A4.
Kaplan-Meier plots of the effect of BRAF mutations on overall survival based upon treatment arm: (A) BRAF wild type (WT) or (B) BRAF mutant. Almost all BRAF mutations are V600E except for two patients. Log-rank P values are reported from an unadjusted analysis. The results refer to all patients from whom mutational analysis was available, which includes pre-KRAS amendment and post-KRAS amendment patients.
FIG A5.
FIG A5.
Smoothed scaled Schoenfeld residual plots. MSI, microsatellite instability; MSI-H, microsatellite instability–high.

Comment in

  • TMB is linked with prognosis.
    Romero D. Romero D. Nat Rev Clin Oncol. 2019 Jun;16(6):336. doi: 10.1038/s41571-019-0206-4. Nat Rev Clin Oncol. 2019. PMID: 30932077 No abstract available.
  • Molecular Markers of Molecular Markers.
    Sorscher S. Sorscher S. J Clin Oncol. 2019 Sep 1;37(25):2291. doi: 10.1200/JCO.19.00746. Epub 2019 Jul 3. J Clin Oncol. 2019. PMID: 31268797 No abstract available.
  • Reply to S. Sorscher.
    Innocenti F, Ou FS, Qu X, Zemla T, Niedzwiecki D, Tam R, Mahajan S, Goldberg RM, Bertagnolli MM, Blanke CD, Sanoff H, Atkins J, Polite B, Venook AP, Lenz HJ, Kabbarah O. Innocenti F, et al. J Clin Oncol. 2019 Sep 1;37(25):2291-2293. doi: 10.1200/JCO.19.01366. Epub 2019 Jul 3. J Clin Oncol. 2019. PMID: 31268798 No abstract available.

References

    1. Siegel RL, Miller KD, Fedewa SA, et al. Colorectal cancer statistics, 2017. CA Cancer J Clin. 2017;67:177–193. - PubMed
    1. Venook AP, Niedzwiecki D, Lenz HJ, et al. Effect of first-line chemotherapy combined with cetuximab or bevacizumab on overall survival in patients with KRAS wild-type advanced or metastatic colorectal cancer: A randomized clinical trial. JAMA. 2017;317:2392–2401. - PMC - PubMed
    1. Schleifman EB, Tam R, Patel R, et al: Next generation MUT-MAP, a high-sensitivity high-throughput microfluidics chip-based mutation analysis panel. PLoS One 9:e90761, 2014 [Erratum: PLoS One 9:e96019, 2014] - PMC - PubMed
    1. Contal C, O’Quigley J. An application of changepoint methods in studying the effect of age on survival in breast cancer. Comput Stat Data Anal. 1999;30:253–270.
    1. Giannakis M, Mu XJ, Shukla SA, et al: Genomic correlates of immune-cell infiltrates in colorectal carcinoma. Cell Reports 15:857-865, 2016 [Erratum: Cell Reports, 2016] - PMC - PubMed

Publication types

MeSH terms