. 2019 May 1;30(10):1182-1197.
doi: 10.1091/mbc.E18-12-0770. Epub 2019 Mar 13.

Stretching magnitude-dependent inactivation of AKT by ROS led to enhanced p53 mitochondrial translocation and myoblast apoptosis

Affiliations

Stretching magnitude-dependent inactivation of AKT by ROS led to enhanced p53 mitochondrial translocation and myoblast apoptosis

Jing Song et al. Mol Biol Cell. .

Abstract

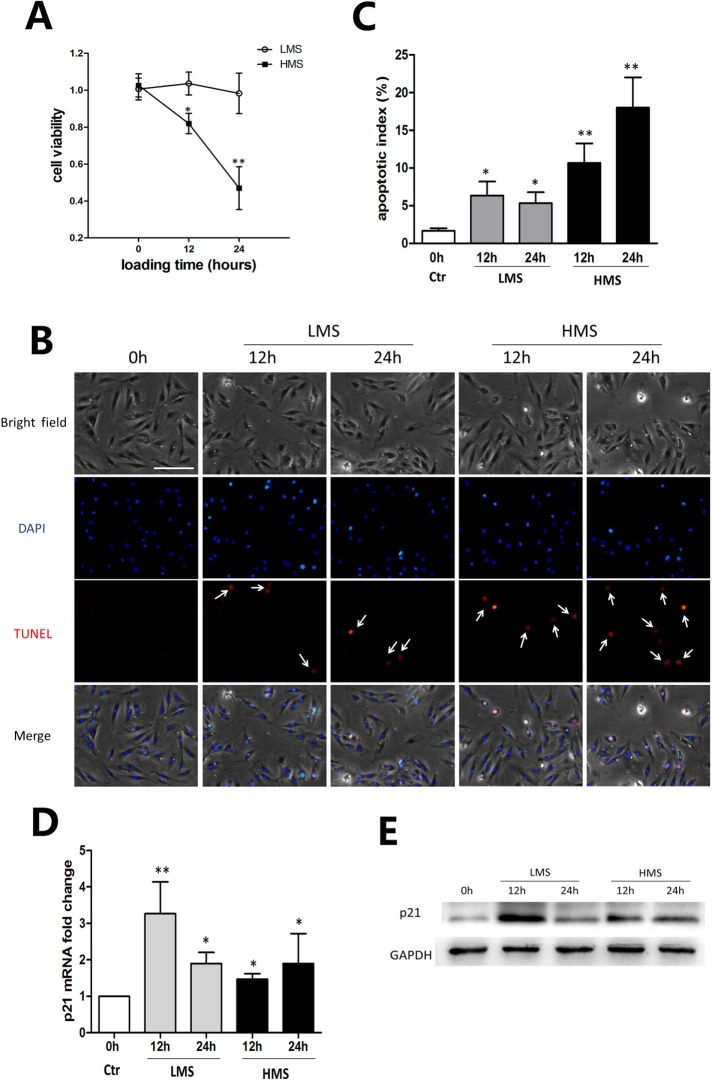
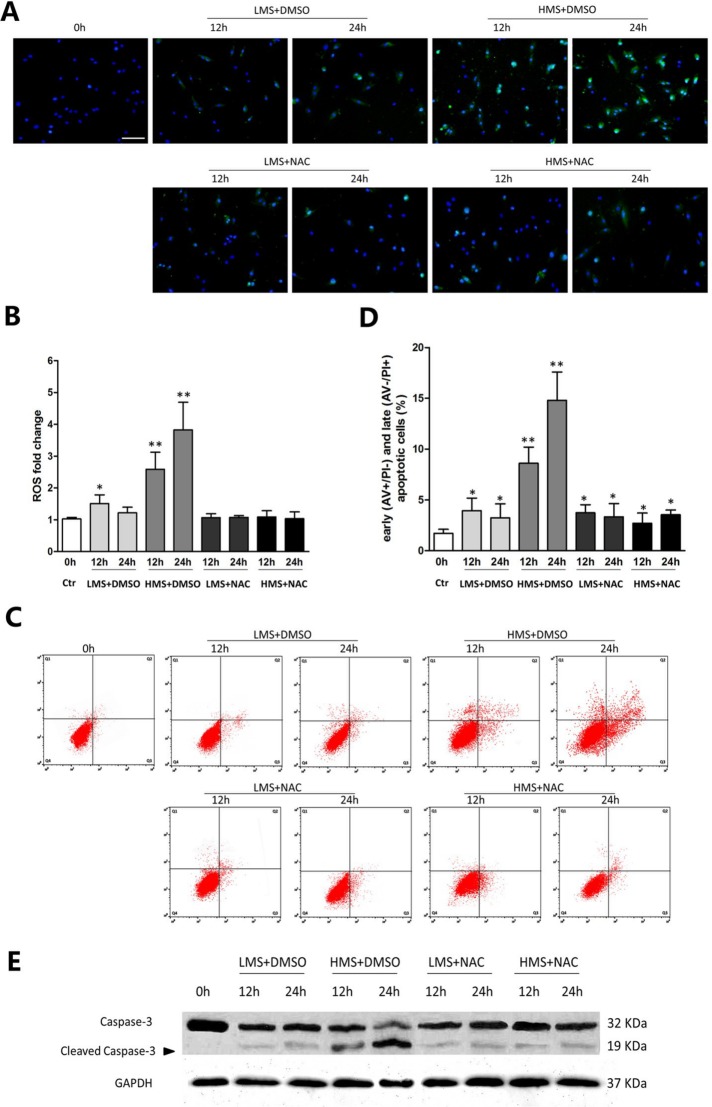
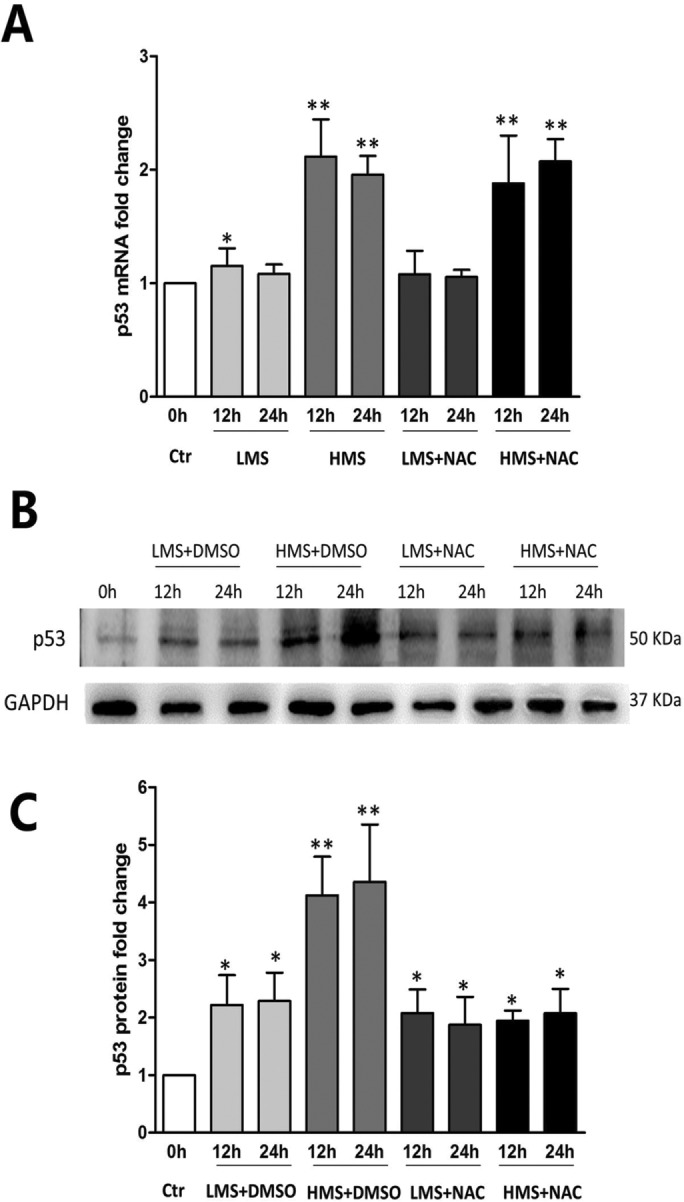
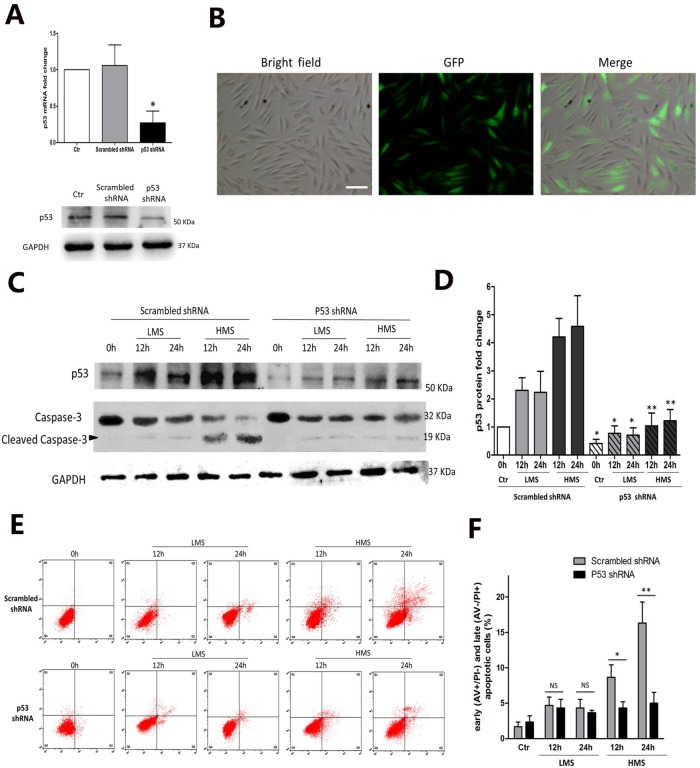
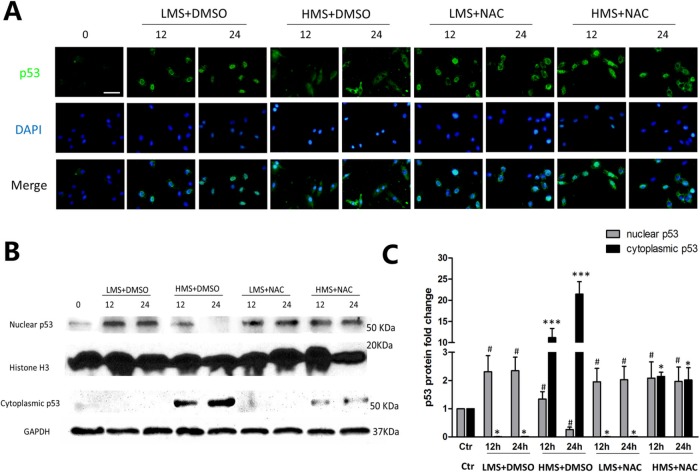
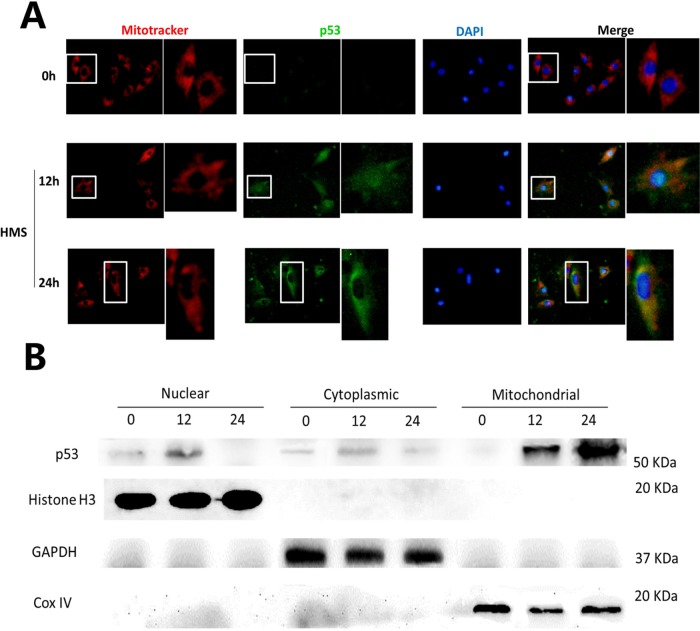
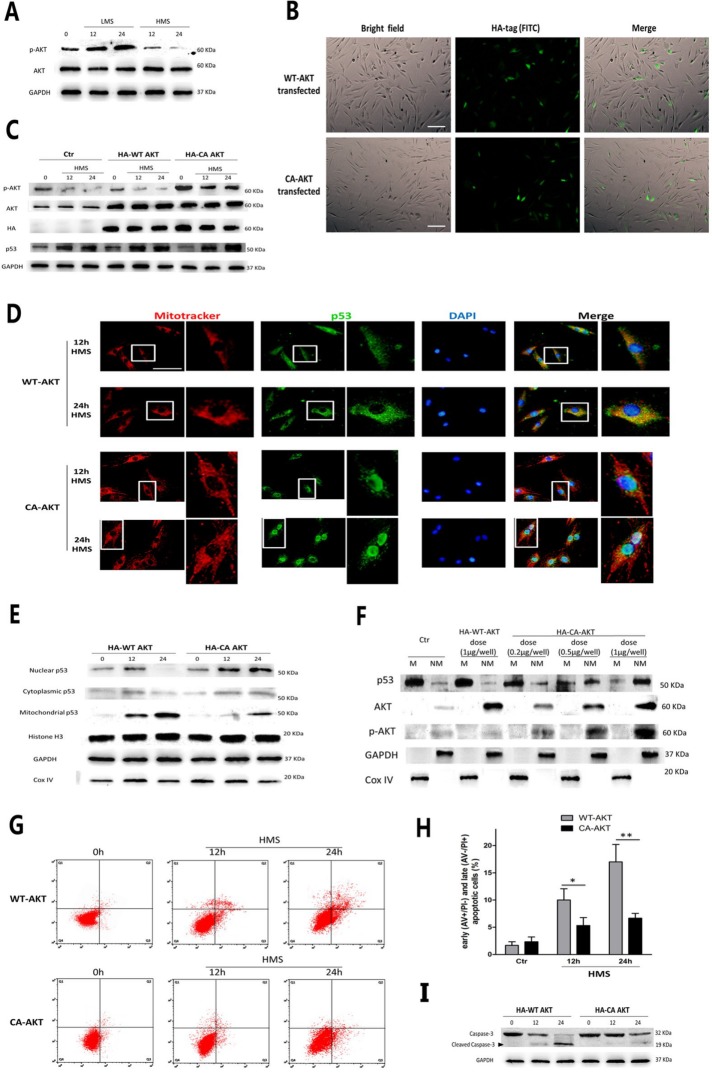
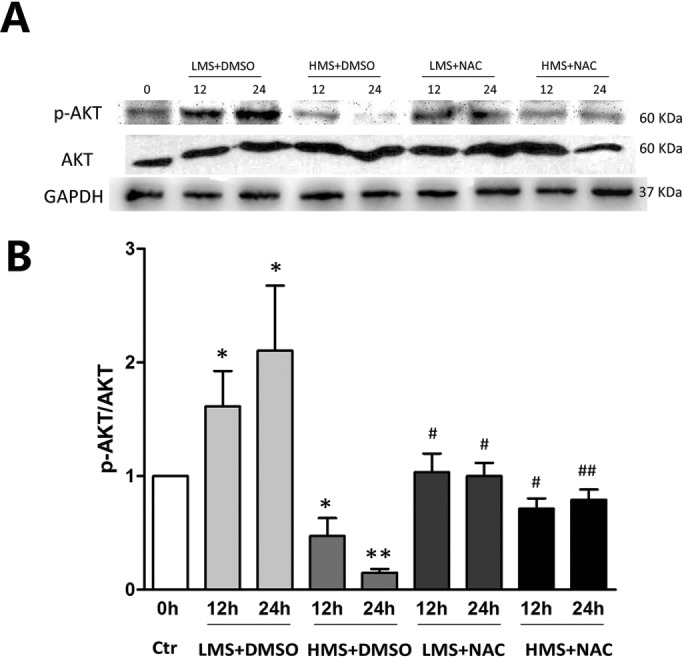
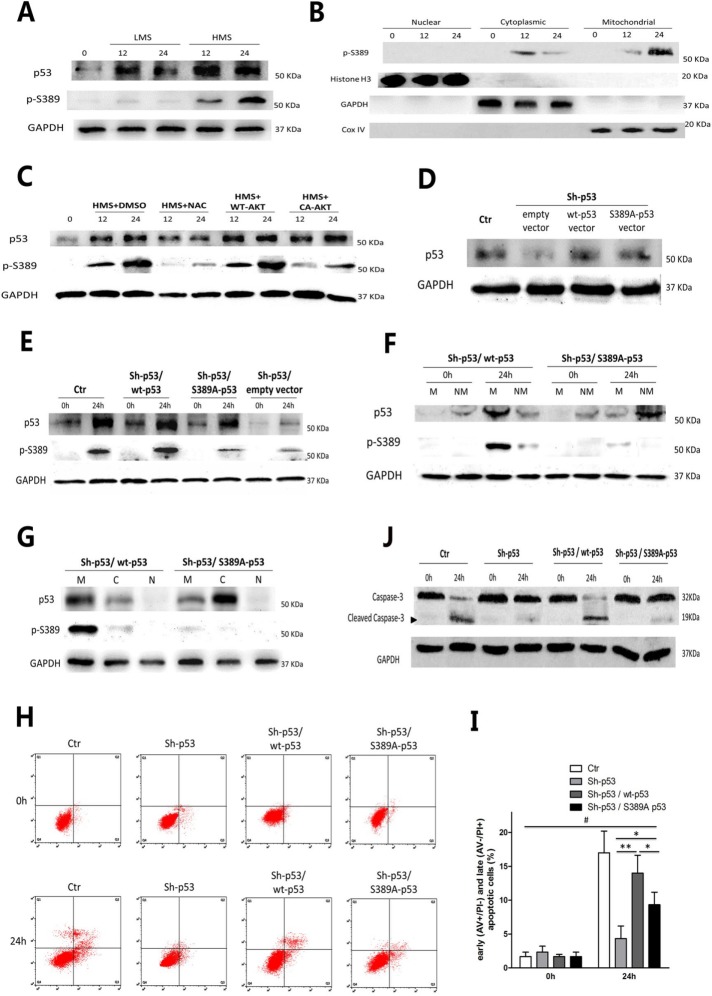
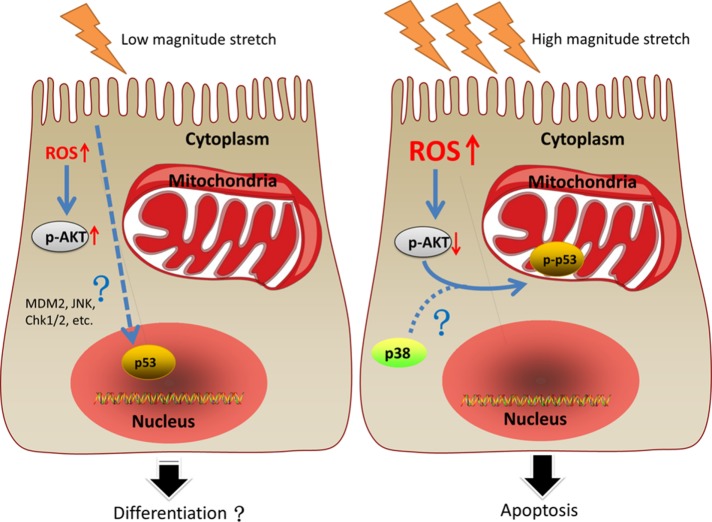
Previously, we had shown that high magnitude stretch (HMS), rather than low magnitude stretch (LMS), induced significant apoptosis of skeletal muscle C2C12 myoblasts. However, the molecular mechanism remains obscure. In this study, we found that p53 protein accumulated in the nucleus of LMS-loaded cells, whereas it translocated into mitochondria of HMS-loaded cells. Knocking down endogenous p53 by shRNA abrogated HMS-induced apoptosis. Furthermore, we demonstrated that overaccumulation of reactive oxygen species (ROS) during HMS-inactivated AKT that was activated in LMS-treated cells, which accounted for the distinct p53 subcellular localizations under HMS and LMS. Blocking ROS generation by N-acetylcysteine (NAC) or overexpressing constitutively active AKT vector (CA-AKT) inhibited HMS-incurred p53 mitochondrial translocation and promoted its nuclear targeting. Moreover, both NAC and CA-AKT significantly attenuated HMS-induced C2C12 apoptosis. Finally, we found that Ser389 phosphorylation of p53 was a downstream event of ROS-inactivated AKT pathway, which was critical to p53 mitochondrial trafficking during HMS stimuli. Transfecting p53-shRNA C2C12s with the mutant p53 (S389A) that was unable to target p53 to mitochondria underwent significantly lower apoptosis than transfection with wild-type p53. Altogether, our study uncovered that mitochondrial localization of p53, resulting from p53 Ser389 phosphorylation through ROS-inactivated AKT pathway, prompted C2C12 myoblast apoptosis during HMS stimulation.


Figures

FIGURE 1:
FIGURE 1:
HMS-promoted apoptosis of C2C12 myoblasts. (A) C2C12 cells were subjected to stretches of 10 and 20% magnitudes for 12 and 24 h, and cell viability was tested by MTT assay. (B) Cells were stretched with 10 and 20% magnitudes for 12 and 24 h, followed by TUNEL and DAPI staining. The apoptotic nuclei were recognized by TUNNEL staining (white arrow). Scale bar, 50 μm. (C) The apoptotic nuclei and total nuclei were counted, and apoptotic index was calculated as the percentage of apoptotic nuclei in total nuclei number per field. Three different fields are included, and data are shown as mean ± SD. (D) Real-time PCR was performed to examine the mRNA level of p21 after stretching of 10 and 20% magnitudes for 12 and 24 h. (E) Representative WB result of p21 protein level after stretching of 10 and 20% magnitudes for 12 and 24 h. The data represent the average of at least three separate experiments. Error bars indicate ± SD for triplicate. Significant differences are indicated by asterisks: *, P < 0.05 and **, P < 0.01, compared with static control cells.
FIGURE 2:
FIGURE 2:
ROS overloading was involved in HMS-induced apoptosis of myoblasts. (A) 2′,7′-Dichlorodihydrofluorescein diacetate (DCFDA) and DAPI staining of myoblasts subjected to LMS and HMS for 12 and 24 h. ROS generation was observed under the fluorescence microscope. Scale bar, 100 μm. (B) ROS levels per 5000 cells of each group were calculated by Microplate Fluorescence Reader FL600, and the data were normalized to values obtained from the control group. (C) AV/PI staining and flow cytometry analysis displayed drastic apoptosis of HMS-stretched myoblasts and attenuated apoptosis when ROS generation was suppressed by NAC. (D) Statistical analysis of the percentage of early (AV+/PI−) and late (AV−/PI+) apoptotic cells subjected to stretch. Data combined from three independent experiments are presented as mean ± SD. (E) Western blots were performed using caspase-3 primary antibody. Same samples were immunoblotted by GAPDH as the loading control. Black arrow indicates the cleaved capase-3 fragment with molecular size around 19 kDa. Significant differences are indicated by asterisks: *, P < 0.05 and **, P < 0.01, compared with static control cells.
FIGURE 3:
FIGURE 3:
Stretch-induced elevation of p53 protein level was partially related to ROS production. (A) Real-time PCR displayed the p53 mRNA level of myoblasts under LMS or HMS stimuli with or without NAC pretreatment. (B) Representative WB result of p53 protein level in myoblasts under LMS or HMS stimuli with or without NAC pretreatment. (C) Densitometric analysis of p53 protein expressions. Data were analyzed by one-way ANOVA and are presented as mean ± SD. Significant differences are shown by *, P < 0.05 and **, P < 0.01, compared with static control cells.
FIGURE 4:
FIGURE 4:
p53 participated in HMS-induced apoptosis of myoblasts. (A) C2C12 myoblasts were transfected with lentivirus vector containing p53 shRNA or scrambled shRNA. After transfection (48 h), cells were collected for real-time PCR and WB analysis to detect the efficiency of p53 silencing. Scrambled shRNA was used as negative control for both real-time PCR and WB results. (B) One week of 2 mg/ml puromycin selection generated the stable p53-knockdown myoblasts (left, light microscopy picture of Sh-p53 cells; middle, fluorescence microscopy picture of the same field; right, merge of light microscopy picture and fluorescence microscopy picture in the same field). Scale bar, 50 μm. (C) Effect of LMS or HMS on protein levels of p53 and cleaved caspase-3 in p53 shRNA or scrambled shRNA infected myoblasts. Same samples were immunoblotted by GAPDH as the loading control. Black arrow indicates the cleaved capase-3 fragment with molecular size around 19 kDa. (D) Densitometric analysis of p53 protein expressions in p53 shRNA or scrambled shRNA infected myoblasts under LMS or HMS stimulation. (E) AV/PI staining and flow cytometry analysis of apoptosis in p53 shRNA or scrambled shRNA infected myoblasts under LMS or HMS stimulation. (F) Statistical analysis of the percentage of early (AV+/PI−) and late (AV−/PI+) apoptotic cells in each group. Data were analyzed with Student’s t test for the p53 silencing group comparing to its negative control in each condition. Significant differences are shown by *, P < 0.05 and **, P < 0.01, compared with scrambled shRNA infected cells.
FIGURE 5:
FIGURE 5:
The effect of ROS on subcellular localization of p53 in myoblasts under LMS or HMS stimuli. (A) Cells were loaded under either HMS or LMS for 12 and 24 h, with or without NAC pretreatment. After this, cells were fixed and permeabilized (see Materials and Methods) and then incubated with p53 antibody. After labeling, cells were extensively washed and localization of p53 was detected by immunofluorescence of anti-mouse IgG-FITC. The figure shows a representative immunostaining analysis after counterstaining with DAPI. (B) Protein samples from the above groups were separated for nuclear and cytoplasmic fractions, and WB experiments were applied using p53 antibody to detect p53 subcellular localization. H3 histone and GAPDH were used as loading controls of nuclear and cytoplasmic fractions. (C) Densitometric analysis of p53 protein expressions in nuclear or cytoplasmic samples. Data were analyzed by one-way ANOVA and are presented as mean ± SD. Significant differences are shown by *, P < 0.05 ; ***, P < 0.001 (nuclear sample); and #, p < 0.05 (cytoplasmic sample), compared with static control cells.
FIGURE 6:
FIGURE 6:
Mitochondrial translocation of p53 in myoblasts under HMS stimuli. (A) Cells were loaded under HMS for 12 and 24 h, and Mito-Tracker Red CMXRos staining was used as a marker of mitochondria before regular immunofluorescence staining. The pictures were representative results displaying p53 nuclear export and mitochondrial localization after 12 and 24 h HMS stimuli. The 0 h group was used as the control group, with the same exposure time being used for the 12 and 24 h groups. The right pictures adjacent to the left ones are magnified pictures of the white rectangular area in the left pictures. (B) WB results further confirmed p53 mitochondrial translocation in myoblasts under HMS stimuli. H3 histone, GAPDH, and Cox IV were used as markers of cytoplasmic, nuclear, and mitochondrial fractions, respectively.
FIGURE 7:
FIGURE 7:
HMS-inactivated AKT prompted p53 nuclear-mitochondrial redistribution and apoptosis. (A) WB results showed that AKT was phosphorylated in LMS-treated C2C12 cells and was dephosphorylated in HMS-treated cells. (B) Transfection efficiency of WT-AKT and CA-AKT plasmids were evaluated by immunostaining with HA antibody and observing green signal under the fluorescence microscope. (C) Representative WB results confirmed that transfecting both WT-AKT and CA-AKT vectors effectively raised the AKT level in both unstretched and HMS-stretched myoblasts, whereas only WT-AKT vector increased the p-AKT level. (D) Immuno­fluorescence results proved that C2C12 cells overexpressing CA-AKT resulted in p53 nuclear import subjected to HMS stimulation, comparing to the counterparts overexpressing WT-AKT that displayed p53 mitochondrial localization under HMS. The right pictures adjacent to the left ones were magnified pictures of the white rectangular area in the left pictures. (E) WB results further confirmed the diminished p53 level in mitochondrial fraction and raised the p53 level in the nuclear fraction in HMS-loaded C2C12 cells transfected by the CA-AKT vector. H3 histone, GAPDH, and Cox IV were used as markers of cytoplasmic, nuclear, and mitochondrial fractions, respectively. (F) Dose-dependent reduction of mitochondrial p53 and elevation of nonmitochondrial p53 in HMS-loaded C2C12 cells by transfection of CA-AKT vector. GAPDH and Cox IV were used as markers of nonmitochondrial and mitochondrial fractions, respectively. (G) AV/PI staining and flow cytometry analysis of apoptosis in HMS-treated C2C12 cells that were transfected with either WT-AKT vector or CA-AKT vector. (H) Statistical analysis of the percentage of early (AV+/PI−) and late (AV−/PI+) apoptotic cells in each group. Data were analyzed with Student’s t test for the CA-AKT group comparing to its negative control WT-AKT group in 12 and 24 h HMS-loaded cells. (I) Western blots were performed using caspase-3 primary antibody. Same samples were immunoblotted by GAPDH as the loading control. Black arrow indicates the cleaved capase-3 fragment with molecular size around 19 kDa. Significant differences are indicated by asterisks: *, P < 0.05 and **, P < 0.01, comparing WT-AKT with CA-AKT in 12 and 24 h loading groups.
FIGURE 8:
FIGURE 8:
Stretching magnitude–dependent regulation of AKT by ROS. (A) Cells were stretched by LMS or HMS for 12 and 24 h, with or without pretreatment with NAC. Phospho-AKT (Ser473) level and total-AKT level were detected by WB. The same samples were immunoblotted by GAPDH as the loading control. (B) Densitometric analysis of the ratio of p-AKT/AKT. Data were analyzed by one-way ANOVA and are presented as mean ± SD. Significant differences are shown by *, P < 0.05 and **, P < 0.01, compared with static control cells, while #, P < 0.05 and ##, P < 0.01 show the significant differences between the stretching alone group and the stretching combined with NAC pretreatment group.
FIGURE 9:
FIGURE 9:
Phosphorylation of p53 Ser389 was required for HMS-indued p53 mitochondrial translocation and myoblast apoptosis. (A) Cells were stretched by LMS or HMS for 12 and 24 h, and p53 phosphorylation on Ser389 was detected by WB. (B) Confirmation of phospho-p53 (Ser389) localization in HMS-loaded C2C12 cells for 12 and 24 h. H3 histone, GAPDH, and Cox IV were used as markers of cytoplasmic, nuclear, and mitochondrial fractions, respectively. (C) HMS-promoted phosphorylation of p53(Ser389) was dependent on the generation of ROS and subsequent dephosphorylation of AKT. Pretreatment with NAC or transfecting with CA-AKT vector efficiently blocked p53(Ser389) phosphorylation under HMS stimuli. (D) Transfection of p53-knockdown C2C12 cells with wild-type p53 vector or mutant p53 (S389A) vector partially rescued the p53 protein level. (E) Mutant p53 (S389A) could not be phosphorylated under 24 h–HMS stimuli, comparing to wild-type p53 in Sh-p53–infected C2C12 cells. (F) Mutant p53 (S389A) could not translocate into mitochondria under 24 h–HMS stimuli, comparing to wild-type p53. M and NM represent mitochondrial and nonmitochondrial portions, respectively. (G) After stimulated by HMS for 24 h, both mutant p53 (S389A) and wild-type p53 transfected cells were subjected to subcellular fraction assay, and the WB result confirmed that mutant p53 (S389A) was mainly accumulated in nonmitochondrial cytoplasm, comparing to wt-p53 that localized in mitochondria. M, C, and N represent mitochondrial, cytoplasmic, and nuclear portions, respectively. (H) AV/PI staining and flow cytometry analysis showed that transfecting wt-p53 vector could reverse the inhibited apoptosis in p53-knockdown C2C12 cells, whereas transfecting mt-p53 (S389A) failed to accomplish a similar effect. (I) Statistical analysis of the percentage of early (AV+/PI−) and late (AV−/PI+) apoptotic cells in each group. Data were analyzed by one-way ANOVA and are presented as mean ± SD. *, P < 0.05 and **, P < 0.01 represent the significant difference among the HMS-treated groups of C2C12 with distinct p53 expression. #, P < 0.05 shows the significant difference between static and stretched cells. (J) Representive WB results of caspase-3 cleavage in each group. Same samples were immunoblotted by GAPDH as the loading control. Black arrow indicates the cleaved capase-3 fragment with molecular size around 19 kDa.
FIGURE 10:
FIGURE 10:
An illustrative view of the different fates of C2C12 myoblasts under LMS or HMS stimulation. Left panel, LMS-induced mild elevation of ROS, resulting in the activation of AKT in C2C12 myoblasts. In addition, p53 was found in the nuclei of LMS-loaded C2C12 cells. Some studies demonstrated that lower magnitude cyclic stretch could promote myogenic differentiation, even though whether those changes in our study were related to C2C12 differentiation had not been explored. Right panel, HMS caused drastic apoptosis of C2C12 cells, which could be ascribed to the massive accumulation of ROS that dephosphorylated AKT. Inactivation of AKT in HMS-loaded C2C12 cells was shown to be necessary for p53 nuclear export in our study, a step required for its further phosphorylation on Ser389 that might involve p38 MAPK. Phospho-p53 (Ser389) translocated to mitochondria of C2C12 cells and induced their apoptosis under HMS stimuli.

Similar articles

Cited by

References

    1. Abraham AG, O’Neill E. (2014). PI3K/Akt-mediated regulation of p53 in cancer. Biochem Soc Trans , 798–803. - PubMed
    1. Akimoto T, Ushida T, Miyaki S, Tateishi T, Fukubayashi T. (2001). Mechanical stretch is a down-regulatory signal for differentiation of C2C12. Mater Sci Eng C , 75–78.
    1. Allen DG, Gervasio OL, Yeung EW, Whitehead NP. (2010). Calcium and the damage pathways in muscular dystrophy. Can J Physiol Pharmacol , 83–91. - PubMed
    1. Andersen JI, Pennisi CP, Fink T, Zachar V. (2018). Focal adhesion kinase activation is necessary for stretch-induced alignment and enhanced differentiation of myogenic precursor cells. Tissue Eng Part A , 631–640. - PubMed
    1. Appella E, Anderson CW. (2001). Post-translational modifications and activation of p53 by genotoxic stresses. Eur J Biochem , 2764–2772. - PubMed

Publication types

MeSH terms

Substances