

A spatio-temporal individual-based network framework for West Nile virus in the USA: Spreading pattern of West Nile virus
- PMID: 30865618
- PMCID: PMC6433293
- DOI: 10.1371/journal.pcbi.1006875
A spatio-temporal individual-based network framework for West Nile virus in the USA: Spreading pattern of West Nile virus
Abstract
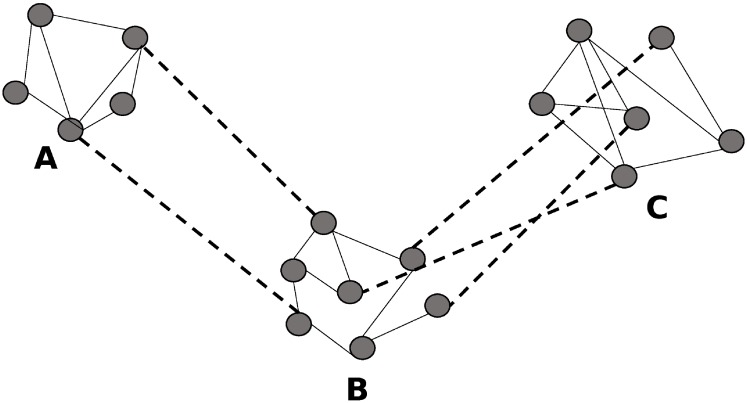
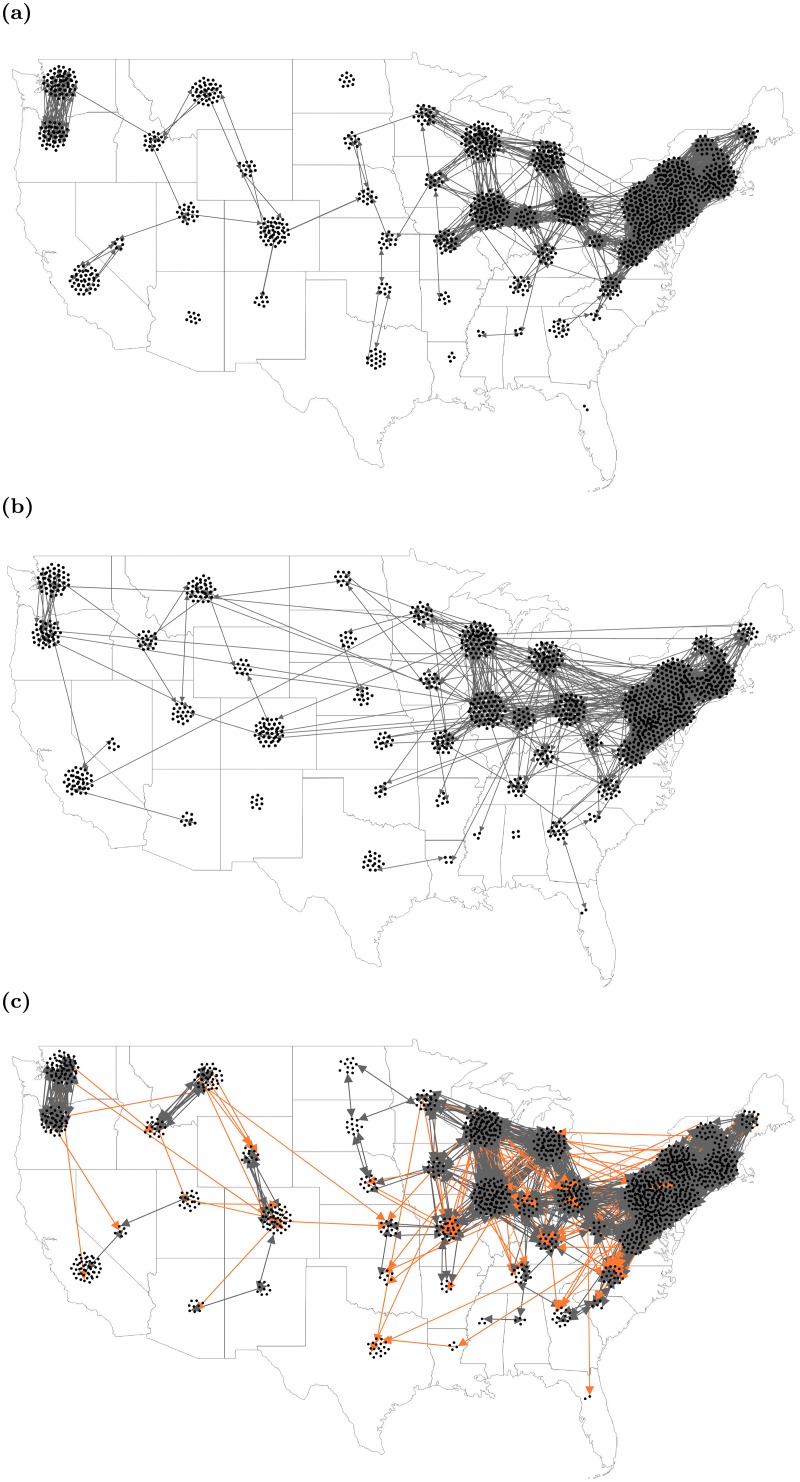
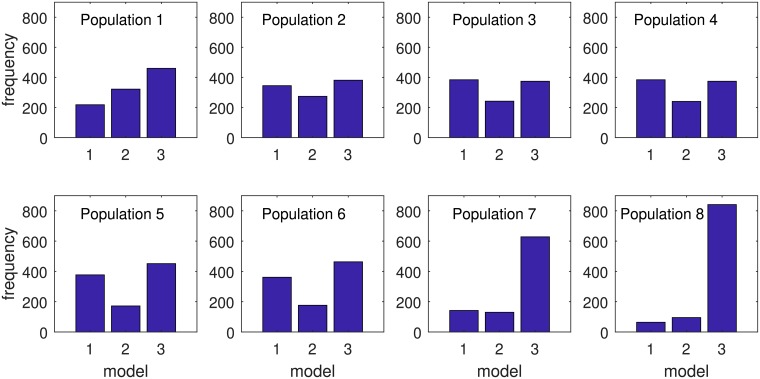
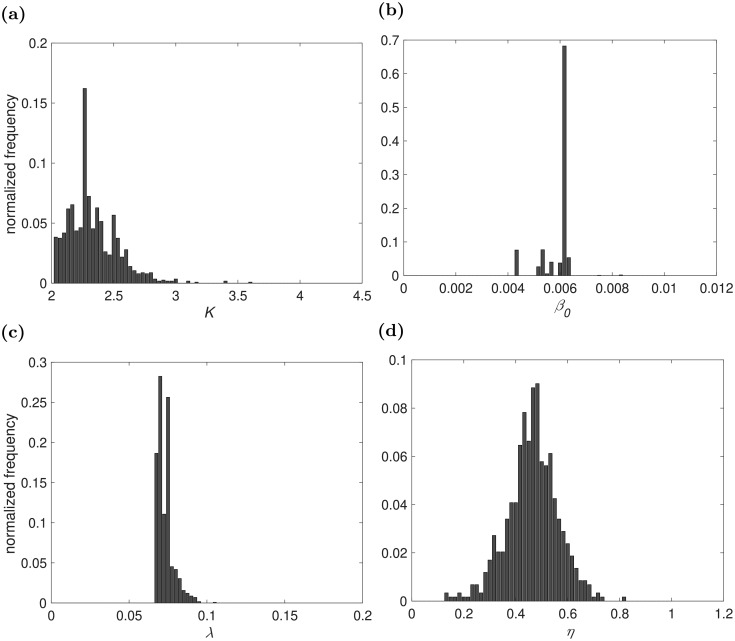
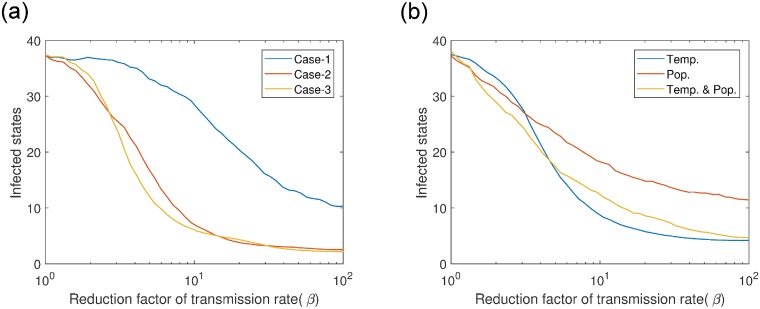
West Nile virus (WNV)-a mosquito-borne arbovirus-entered the USA through New York City in 1999 and spread to the contiguous USA within three years while transitioning from epidemic outbreaks to endemic transmission. The virus is transmitted by vector competent mosquitoes and maintained in the avian populations. WNV spatial distribution is mainly determined by the movement of residential and migratory avian populations. We developed an individual-level heterogeneous network framework across the USA with the goal of understanding the long-range spatial distribution of WNV. To this end, we proposed three distance dispersal kernels model: 1) exponential-short-range dispersal, 2) power-law-long-range dispersal in all directions, and 3) power-law biased by flyway direction -long-range dispersal only along established migratory routes. To select the appropriate dispersal kernel we used the human case data and adopted a model selection framework based on approximate Bayesian computation with sequential Monte Carlo sampling (ABC-SMC). From estimated parameters, we find that the power-law biased by flyway direction kernel is the best kernel to fit WNV human case data, supporting the hypothesis of long-range WNV transmission is mainly along the migratory bird flyways. Through extensive simulation from 2014 to 2016, we proposed and tested hypothetical mitigation strategies and found that mosquito population reduction in the infected states and neighboring states is potentially cost-effective.
Conflict of interest statement
The authors have declared that no competing interests exist.
Figures
Similar articles
-
The human and animal health impacts of introduction and spread of an exotic strain of West Nile virus in Australia.Prev Vet Med. 2013 May 1;109(3-4):186-204. doi: 10.1016/j.prevetmed.2012.09.018. Epub 2012 Oct 23. Prev Vet Med. 2013. PMID: 23098914
-
An Integrative Eco-Epidemiological Analysis of West Nile Virus Transmission.Ecohealth. 2017 Sep;14(3):474-489. doi: 10.1007/s10393-017-1249-6. Epub 2017 Jun 5. Ecohealth. 2017. PMID: 28584951 Free PMC article.
-
[West Nile virus. Prevalence and significance as a zoonotic pathogen].Bundesgesundheitsblatt Gesundheitsforschung Gesundheitsschutz. 2004 Jul;47(7):653-60. doi: 10.1007/s00103-004-0864-x. Bundesgesundheitsblatt Gesundheitsforschung Gesundheitsschutz. 2004. PMID: 15254820 Review. German.
-
Quantifying the Risk of Introduction of West Nile Virus into Great Britain by Migrating Passerine Birds.Transbound Emerg Dis. 2016 Oct;63(5):e347-59. doi: 10.1111/tbed.12310. Epub 2014 Dec 17. Transbound Emerg Dis. 2016. PMID: 25516263
-
West Nile Disease Epidemiology in North-West Africa: Bibliographical Review.Transbound Emerg Dis. 2016 Dec;63(6):e153-e159. doi: 10.1111/tbed.12341. Epub 2015 Mar 6. Transbound Emerg Dis. 2016. PMID: 25753775 Review.
Cited by
-
Comparison of West Nile Virus Disease in Humans and Horses: Exploiting Similarities for Enhancing Syndromic Surveillance.Viruses. 2023 May 24;15(6):1230. doi: 10.3390/v15061230. Viruses. 2023. PMID: 37376530 Free PMC article. Review.
-
Predicting West Nile virus transmission in North American bird communities using phylogenetic mixed effects models and eBird citizen science data.Parasit Vectors. 2019 Aug 8;12(1):395. doi: 10.1186/s13071-019-3656-8. Parasit Vectors. 2019. PMID: 31395085 Free PMC article.
-
Are all underimmunized measles clusters equally critical?medRxiv [Preprint]. 2023 Apr 17:2023.04.11.23288263. doi: 10.1101/2023.04.11.23288263. medRxiv. 2023. Update in: R Soc Open Sci. 2023 Aug 16;10(8):230873. doi: 10.1098/rsos.230873. PMID: 37131740 Free PMC article. Updated. Preprint.
-
Are all underimmunized measles clusters equally critical?R Soc Open Sci. 2023 Aug 16;10(8):230873. doi: 10.1098/rsos.230873. eCollection 2023 Aug. R Soc Open Sci. 2023. PMID: 37593709 Free PMC article.
-
A parsimonious Bayesian predictive model for forecasting new reported cases of West Nile disease.Infect Dis Model. 2024 Jun 28;9(4):1175-1197. doi: 10.1016/j.idm.2024.06.004. eCollection 2024 Dec. Infect Dis Model. 2024. PMID: 40385315 Free PMC article.
References
-
- Centers for Disease Control and Prevention;. Available from: https://www.cdc.gov/westnile/index.html.
-
- Bergsman LD, Hyman JM, Manore CA. A mathematical model for the spread of West Nile virus in migratory and resident birds. Math Biosci Eng. 2016;13(2):401–24 - PubMed
Publication types
MeSH terms
LinkOut - more resources
Full Text Sources
Medical
