. 2019 Mar 12;26(11):3037-3050.e4.
doi: 10.1016/j.celrep.2019.02.052.

The FBXW7-SHOC2-Raptor Axis Controls the Cross-Talks between the RAS-ERK and mTORC1 Signaling Pathways

Affiliations

The FBXW7-SHOC2-Raptor Axis Controls the Cross-Talks between the RAS-ERK and mTORC1 Signaling Pathways

Chuan-Ming Xie et al. Cell Rep. .

Abstract

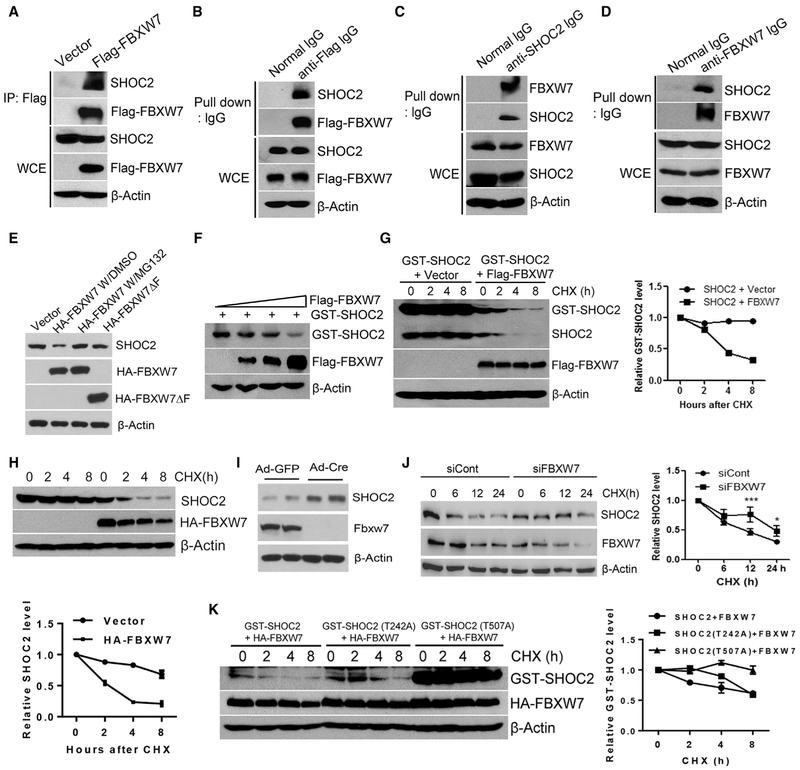
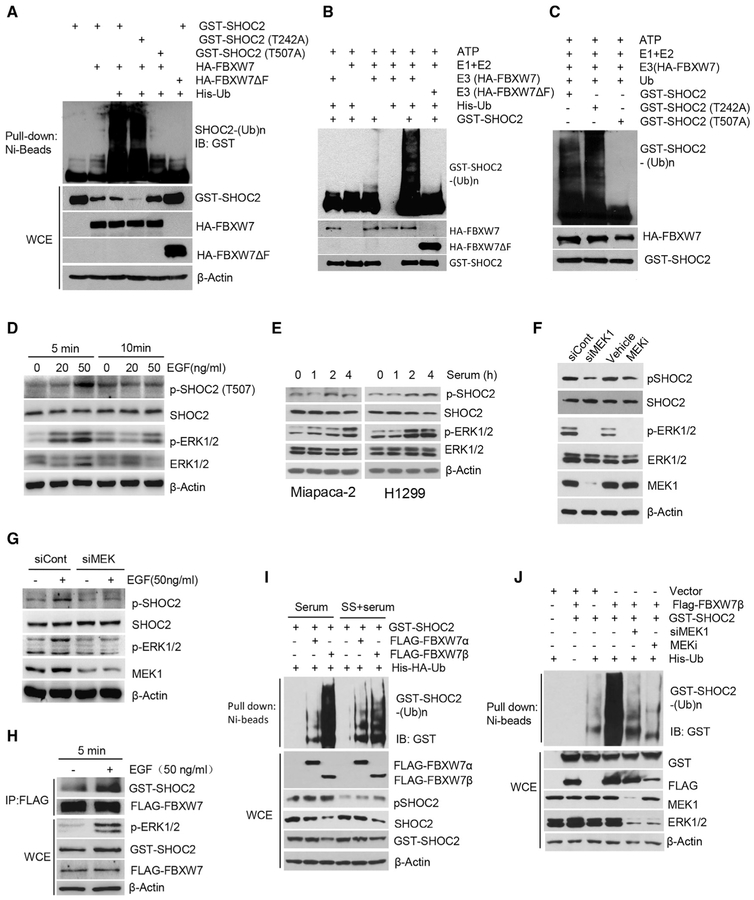
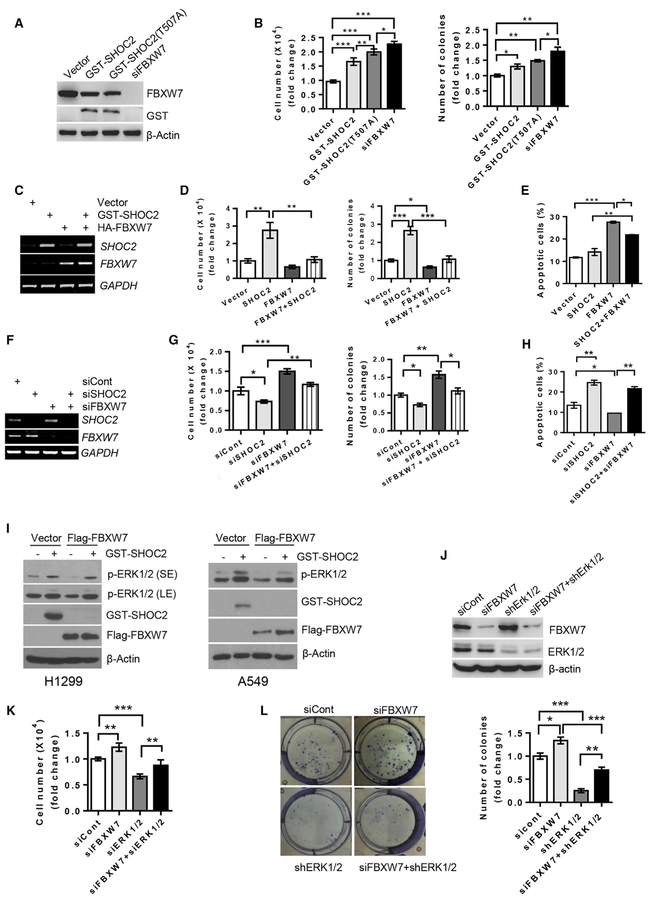
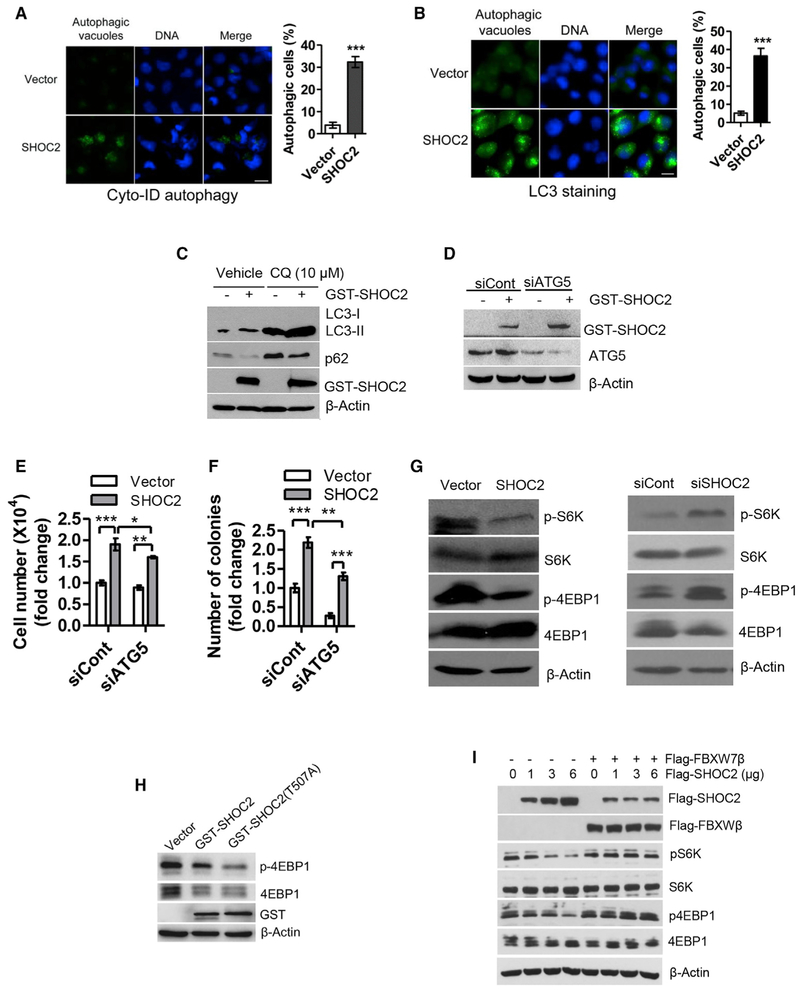
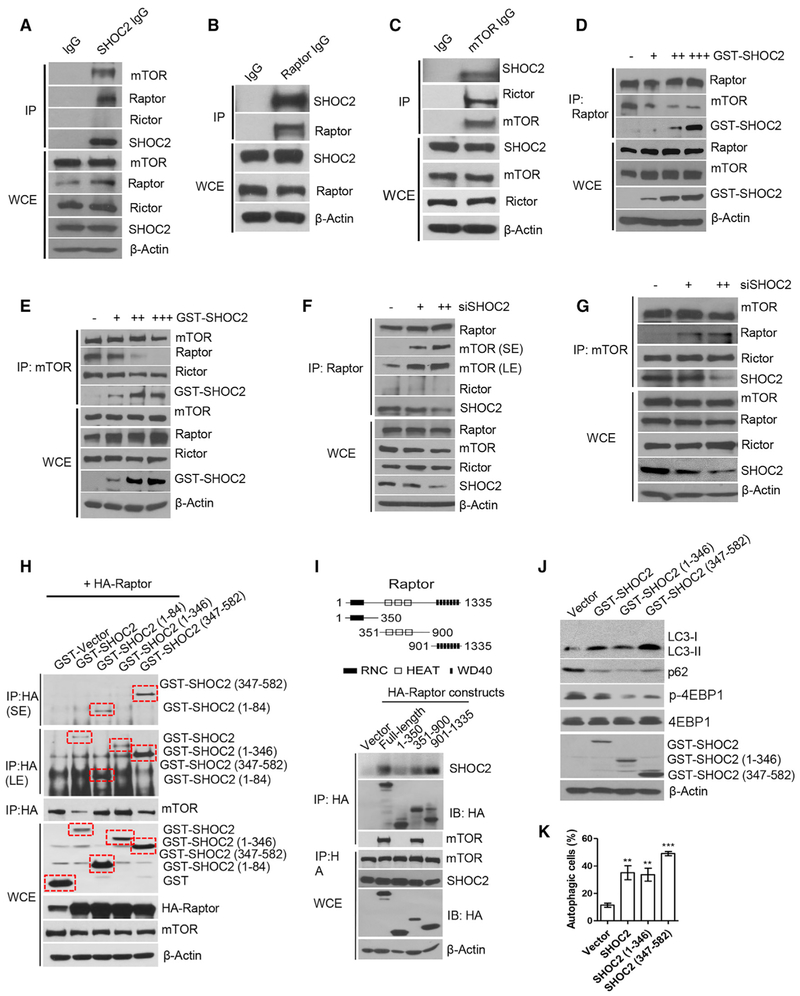
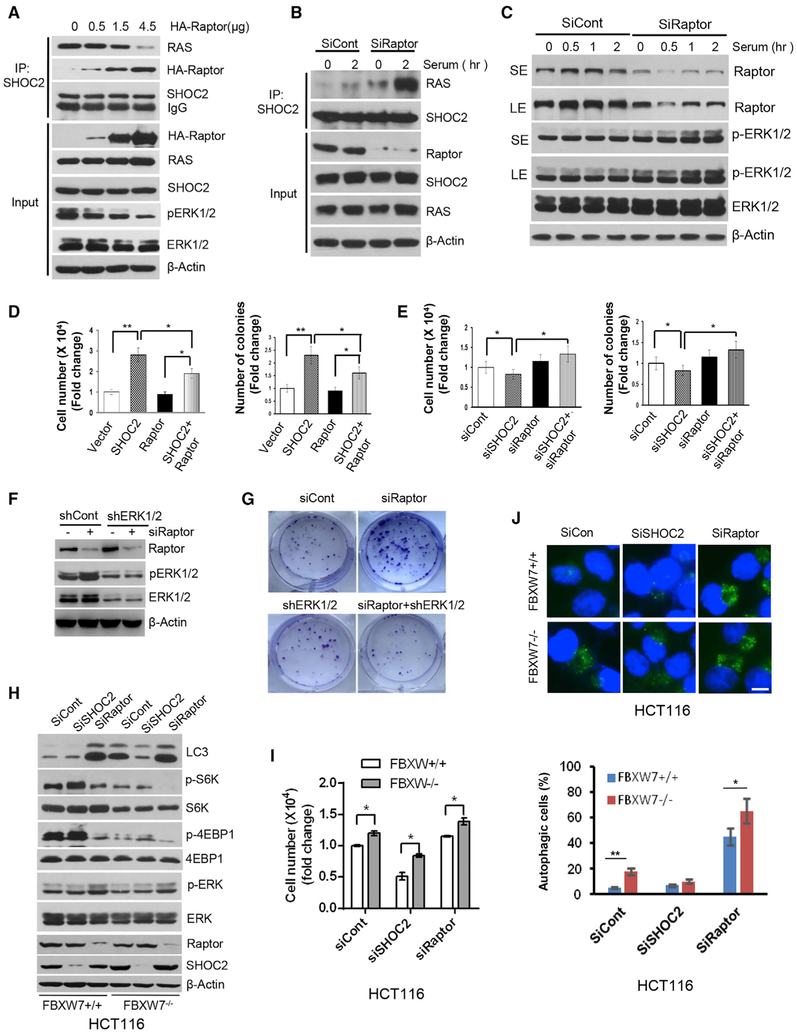
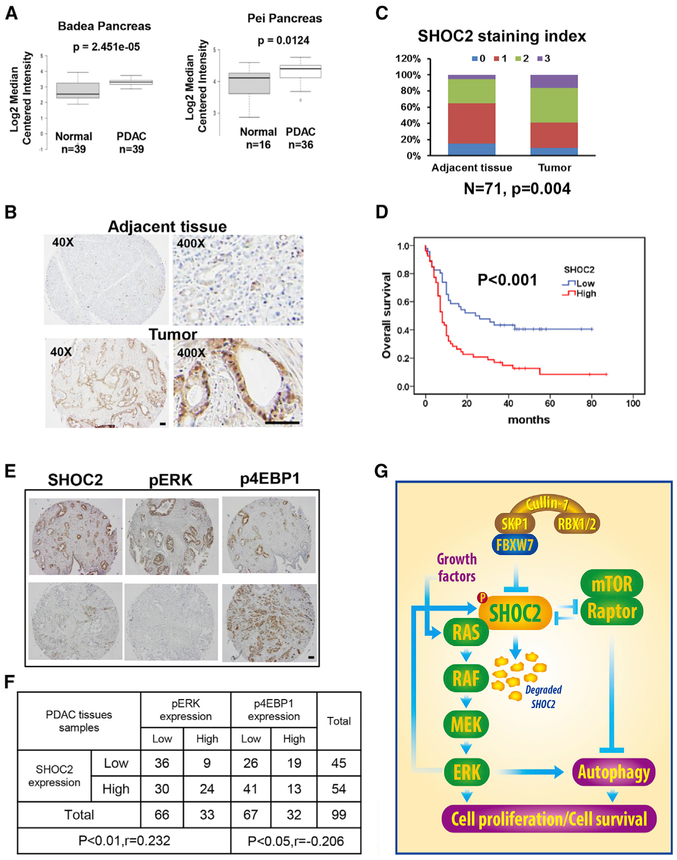
FBXW7 is a tumor suppressive E3 ligase, whereas RAS-ERK and mechanistic target of rapamycin kinase (mTORC1) are two major oncogenic pathways. Whether and how FBXW7 regulates these two oncogenic pathways are unknown. Here, we showed that SHOC2, a RAS activator, is a FBXW7 substrate. Growth stimuli trigger SHOC2 phosphorylation on Thr507 by the mitogen-activated protein kinase (MAPK) signal, which facilitates FBXW7 binding for ubiquitylation and degradation. FBXW7-mediated SHOC2 degradation terminates the RAS-MAPK signals and inhibits proliferation. Furthermore, SHOC2 selectively binds to Raptor to competitively inhibit the Raptor-mTOR binding to inactivate mTORC1 and induce autophagy, whereas Raptor binding of SHOC2 inhibits the SHOC2-RAS binding to block the MAPK pathway and proliferation. Finally, SHOC2 is overexpressed in pancreatic cancer, which correlated with poor patient survival. SHOC2 mutations were found in lung cancer tissues with gain-of-function activity. Collectively, the SHOC2-Raptor interaction triggers negative cross-talk between RAS-ERK and mTORC1 pathways, whereas FBXW7 regulates both pathways by targeting SHOC2 for ubiquitylation and degradation.

Keywords: FBXW7; MAPK; RAS-RAF-ERK; Raptor; SCF E3 ligase; SHOC2; autophagy; cell proliferation; mTOR; ubiquitylation and degradation.


Conflict of interest statement

DECLARATION OF INTERESTS

The authors declare no competing financial interests.

Figures

Figure 1.
Figure 1.. FBXW7 Binds to SHOC2 and Shortens Its Protein Half-Life
(A and B) 293 cellsweretransfected with the indicated plasmidsfor 48 h, followed by immunoprecipitation and immunoblotting (IB) with anti-FLAG antibody (Ab) (A) or anti-mouse lgG antibody (B). WCE, whole-cell extract. (C and D) H1299 cells were lysed and incubated with normal immunoglobulin G (IgG), anti-SHOC2 (C), or anti-FBXW7 Ab (D), and then pulled down with protein A/G beads, followed by IB. (E and F) H1299 (E) or 293 (F) cells were transfected with indicated plasmids for 48 h; one indicated sample was treated with MG132 4 h before harvesting, followed by IB. (G, H, J, and K) 293 (G and K) and H1299 (H and J) cells were transfected with indicated plasmids(G, H, and K) or siRNA targeting FBXW7 (J) for 48 h, followed by cycloheximide (CHX) treatment for different time periods and harvested for IB. The band density was quantified by AlphaEaseFC software. The data shown are from a single representative experiment out of two repeats. (I) MEF cells derived from two independent Fbxw7-fl/fl mouse embryos (Zhang et al., 2016b) were infected with adenovirus encoding Cre-recombinase (Ad-Cre) to remove floxed exon of Fbxw7 or Ad-GFP control, followed by IB.
Figure 2.
Figure 2.. FBXW7 Promotes SHOC2 Ubiquitylation, Triggered by MAPK-Mediated Phosphorylation on Thr507
(A) 293 cells were transfected with the indicated plasmids, lysed with 6 M guanidine solution, pulled down with Ni-bead, and followed by IB for GST-SHOC2, or direct IB. (B and C) 293 cells were transfected with WT SHOC 2 (B) or SHOC2 mutants (C), followed by IP purification and in vitro ubiquitylation. The blot was probed with anti-GST Ab. (D and E) A549 cells (D) or Miapaca-2 and H1299 cells (E) were treated with EGF or serum for indicated time periods, followed by IB for p-SHOC2 (T507), SHOC2, p-ERK, and ERK. (F and G) H1299 cells were transfected with MEK1 siRNA (siMEK1) in the presence (G) or absence (F) of EGF or treated with MEK1 inhibitor (PD98059, MEKi) for 48 h, followed by IB. (H) A549 cells were transfected with Flag-FBXW7 for 48 h in the presence or absence of EGF (50 ng/ml) for 5 min, followed by immunoprecipitation and IB with indicated Abs. WCE, whole-cell extract. (I and J) HCT116 FBXW7−/− cells were transfected with indicated plasmids (I) or MEK1 siRNA in the presence or absence of MEKi (PD98059) (J), followed by indicated serum treatment. Cells were then lysed with 6 M guanidine solution, pulled down with Ni-bead, and followed by IB. WCE, whole-cell extract.
Figure 3.
Figure 3.. SHOC2 Promotes Cell Growth, Blocked by FBXW7 and ERK Silencing
(A–H) A549 (A, B, E, and H) or H1299 (C, D, F, and G) cells were transfected with the indicated plasmids or siRNAs. Forty-eight h later, a portion of cells were harvested for RT-PCR or IB analysis (A, C, and F). Another portion was grown for 48 h, cell numbers (left: B, D, and G) were counted, and percentage of apoptotic cells (E and H) were measured. Still other portions were plated into 6-well plates, and colonies with more than 50 cells counted after 9–13 days (right: B, D, and G). The error bars represent SEM from three independent experiments; *p < 0.05, **p < 0.01, and ***p < 0.001. (I–L) H1299 (I–L) or A549 (I, right) cells were transfected with indicated plasmids or siRNAs and harvested 48 h later for IB (I and J) or counting cell numbers (K) and colonies (L). The error bars represent SEM from three independent experiments; *p < 0.05, **p < 0.01, and ***p < 0.001.
Figure 4.
Figure 4.. SHOC2 Promotes Autophagy by mTOR Inactivation for Cell Proliferation
(A and B) H1299 cells were transfected with GST-SHOC2 for 48 h and then stained with Cyto-ID Autophagy detection kit (A) or with LC3 Ab (B). Cells containing more than 10 autophagic vacuoles (A) or 5 LC3 dots (B) were counted as autophagic cells with at least 200 cells counted in each group. The data shown are from a single representative experiment out of three repeats. ***p < 0.001. Error bar represents SEM. Scale bar, 20 μm. (C–G) H1299 cells were transfected with GST-SHOC2 or siRNA targeting SHOC2 (siSHOC2) or ATG5 (siATG5) for 24 h, followed by exposure to 10 μM CQ (C) for 24 h or for 48 h (D–G). Cell number was counted (E). A portion of cells were harvested for IB analysis (C, D, and G). The other portion of cells was plated into 6-well plates and colonies counted after 9–13 days (F). The error bars represent SEM from three independent experiments, *p < 0.05, **p < 0.01, ***p < 0.001. (H and I) A549 (H) or Miapaca-2 (I) cells were transfected with indicated plasmids for 48 h, followed by IB with indicated Abs.
Figure 5.
Figure 5.. SHOC2 Binds to Raptor and Competitively Inhibits Raptor-mTOR Binding
(A–C) H1299 (A) or Huh7 (B and C) cell lysates were prepared for IP, followed by IB with indicated Abs. (D–G) H1299 (D and F) or A549 (E and G) cells were transfected with indicated plasmids or siRNA oligos for 48 h, followed by IP or IB with indicated Abs. (H and I) 293 cells were transfected with indicated plasmids of SHOC2 (H) or Raptor (I) for 48 h, followed by IP and IB with indicated Abs. The domain structure of Raptor is shown (I, top). (J and K) H1299 cells were transfected with indicated plasmids for 48 h, followed by IB (J), or staining with Cyto-ID Autophagy detection kit (K). Shown are mean ± SEM from three independent experiments, **p < 0.01, ***p < 0.001.
Figure 6.
Figure 6.. Raptor Negatively Regulates the RAS-ERK Signal by Disrupting the SHOC2-RAS Binding
(A–C) MiaPaCa-2 pancreatic cancer cells were transfected with indicated concentrations of HA-Raptorplasmids (A) or siRNA oligos targeting Raptor (B and C) for 48 h, followed by IP or IB with indicated Abs or serum-starved for 24 h, followed by serum addition (C). Cells were harvested at various time points for IB. (D and E) MiaPaCa-2 cells were transfected with the indicated plasmids (D) or siRNA oligos (E) for 48 h. Transfected cells were plated into 6-well plates. Cell numbers or colonies were counted at 48 h or 9 days later. The error bars represent SEM from three independent experiments; *p < 0.05 and **p < 0.01. (F and G) H1299 cells were transfected with indicated siRNA oligos or short hairpin RNA (shRNA), followed by IB (F) and clonogenic assay (G). (H-J) HCT116 cells with or without FBXW7 were transfected with indicated siRNAs for 48h, followed by IB with indicated Abs (H), cell growth analysis using cell number (I), or autophagy analysis using LC3 staining (J). Scale bar, 10 μm. The error bars represent SEM from three independent experiments; *p < 0.05 and **p < 0.01.
Figure 7.
Figure 7.. Alterations of SHOC2 in Human Pancreatic Cancer
(A) SHOC2 mRNA was elevated in pancreas tumors. Data were from studies by Badea et al., (2008) and Pei et al., (2009). (B and C) Human pancreatic tumor tissue microarray was stained with anti-SHOC2 Ab (B). SHOC2 staining indexes in tumors versus adjacent tissues are shown as stacked columns (C). Scale bar, 100 μm. (D) SHOC2 staining in human pancreatic tumor tissue microarray was scored at the scales of 0–3. Overall survival (OS) was estimated with the Kaplan-Meier method, whereas Log-rank tests were used to compare OS based upon SHOC2 staining (scales 2–3 versus 0–1). All studies were conducted in double-blind manner. (E and F) Human pancreatic tumor tissue microarray was stained for expression of SHOC2, p-ERK, and p4EBP1 (E) and scored based upon staining intensity. Data were analyzed using SPSS software to obtain correlation coefficient (p < 0.01, p < 0.05, Pearson’s test) (F). Scale bar, 100 μm. (G) Working model. FBXW7 binds to SHOC2 and promotes its ubiquitylation and degradation upon phosphorylation on SHOC2-Thr507 by the MAPK signal. Depletion of SHOC2 inactivates the RAS-ERK signal, thus inhibiting cell proliferation as a mechanism for FBXW7 to suppress growth. Through the SHOC2-Raptor binding, SHOC2 negatively regulates the mTORC1 signal to induce autophagy, whereas Raptor negatively regulates the RAS-ERK signal to block proliferation, establishing the negative cross-talks between two oncogenic pathways.

References

    1. Badea L, Herlea V, Dima SO, Dumitrascu T, and Popescu I (2008). Combined gene expression analysis of whole-tissue and microdissected pancreatic ductal adenocarcinoma identifies genes specifically overexpressed in tumor epithelia. Hepatogastroenterology 55, 2016–2027. - PubMed
    1. Berger AW, Schwerdel D, Ettrich TJ, Hann A, Schmidt SA, Kleger A, Marienfeld R, and Seufferlein T (2017). Targeted deep sequencing of circulating tumor DNA in metastatic pancreatic cancer. Oncotarget 9, 2076–2085. - PMC - PubMed
    1. Bernis C, Vigneron S, Burgess A, Labbé JC, Fesquet D, Castro A, and Lorca T (2007). Pin1 stabilizes Emi1 during G2 phase by preventing its association with SCF(betatrcp). EMBO Rep. 8, 91–98. - PMC - PubMed
    1. Cardenas ME, Cutler NS, Lorenz MC, Di Como CJ, and Heitman J (1999). The TOR signaling cascade regulates gene expression in response to nutrients. Genes Dev. 13, 3271–3279. - PMC - PubMed
    1. Carrière A, Cargnello M, Julien LA, Gao H, Bonneil E, Thibault P, and Roux PP (2008). Oncogenic MAPK signaling stimulates mTORC1 activity by promoting RSK-mediated raptor phosphorylation. Curr. Biol. 18, 1269–1277. - PubMed

Publication types

MeSH terms

Substances