. 2019 Mar 7;20(5):1158.
doi: 10.3390/ijms20051158.

Key Role of Reactive Oxygen Species (ROS) in Indirubin Derivative-Induced Cell Death in Cutaneous T-Cell Lymphoma Cells

Affiliations

Key Role of Reactive Oxygen Species (ROS) in Indirubin Derivative-Induced Cell Death in Cutaneous T-Cell Lymphoma Cells

Marwa Y Soltan et al. Int J Mol Sci. .

Abstract

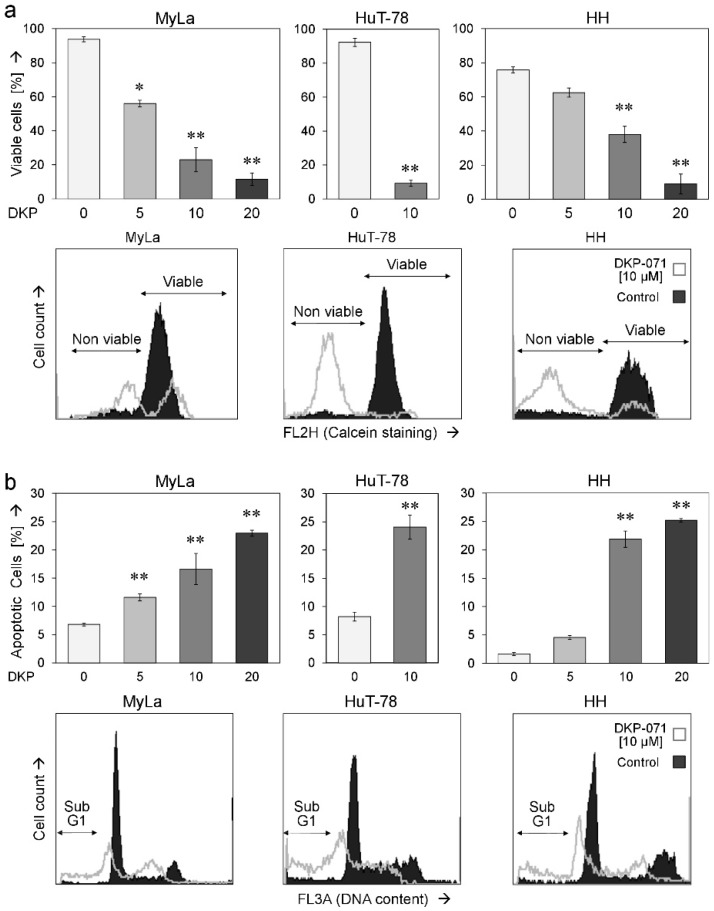
Cutaneous T-cell lymphoma (CTCL) may develop a highly malignant phenotype in its late phase, and patients may profit from innovative therapies. The plant extract indirubin and its chemical derivatives represent new and promising antitumor strategies. This first report on the effects of an indirubin derivative in CTCL cells shows a strong decrease of cell proliferation and cell viability as well as an induction of apoptosis, suggesting indirubin derivatives for therapy of CTCL. As concerning the mode of activity, the indirubin derivative DKP-071 activated the extrinsic apoptosis cascade via caspase-8 and caspase-3 through downregulation of the caspase antagonistic proteins c-FLIP and XIAP. Importantly, a strong increase of reactive oxygen species (ROS) was observed as an immediate early effect in response to DKP-071 treatment. The use of antioxidative pre-treatment proved the decisive role of ROS, which turned out upstream of all other proapoptotic effects monitored. Thus, reactive oxygen species appear as a highly active proapoptotic pathway in CTCL, which may be promising for therapeutic intervention. This pathway can be efficiently activated by an indirubin derivative.

Keywords: CTCL; XIAP; apoptosis; c-FLIP; cell viability.


Conflict of interest statement

The authors declare no conflict of interest.

Figures

Figure 1
Figure 1
Decreased cell proliferation of CTCL cells by DKP-071. (a) Chemical structure of the indirubin derivative DKP-071 (termed substance 9d in [31]). (b) Cell cluster formation in CTCL cell lines MyLa, HuT-78 and HH. Control cells (Ctr) are shown vs. cells treated for 48 h with 10 µM DKP-071 (magnification: 1:40). Many independent experiments showed the same result. (c) Cell proliferation of MyLa, HuT-78 and HH, at 24 h in response to treatment with 5, 10 and 20 µM DKP-071 (DKP). Cell proliferation data were determined by WST-1 assay, and values are shown in relation (rel) to negative controls (0), which were set to “1”. Statistical significance is indicated (** p < 0.01). (d) Cytotoxicity was determined at 24 h in MyLa and in HH cells by LDH release assay. Values are shown in relation (rel) to H2O2-treated positive controls, which were set to “1”.
Figure 2
Figure 2
Reduced cell viability and induction of apoptosis. (a) Cell viability and (b) apoptosis were determined in three cell lines, in response to 48 h treatment with DKP-071 (5, 10 and 20 µM for MyLa and HH as well as 10 µM for HuT-78). Values were determined by calcein staining (a) and propidiumiodide staining (b), respectively. Characteristic histograms are shown for each cell line (10 µM treatment, overlays with controls); fractions of non-viable and viable as well as of apoptotic cells (sub-G1) are indicated. Mean values of triplicates +/− SDs of a representative experiment are shown. Statistical significance is indicated (treated cells vs. controls; * p < 0.05; ** p < 0.01).
Figure 3
Figure 3
Effects on mitochondrial membrane potential and on ROS levels. (a) Relative changes in mitochondrial membrane potential (MMP) were determined at 5 h and 24 h in three CTCL cell lines in response to treatment with DKP-071 (10 µM). Mean values of triplicates +/− SD are shown; a second independent experiment series of MyLa revealed highly comparable results. Representative histograms (overlays of treated cells vs. controls) are given on the right side. (b) ROS levels were determined at 2 h of treatment. Mean values of triplicates +/− SD are shown; for MyLa, three independent experiments, each one with triplicates, revealed highly comparable results. Representative histograms (overlays of treated cells vs. controls) are given on the right side. Statistical significance is indicated (treated cells vs. controls; * p < 0.05; ** p < 0.01).
Figure 4
Figure 4
ROS suppression by antioxidative treatment. ROS levels are shown in MyLa in response to DKP-071 (10 µM). In addition, antagonists as vitamin E (VE, 1 mM), N-acetyl cysteine (NAC, 1 mM), the pancaspase inhibitor QVD-Oph (QVD, 10 µM), as well as combined NAC and VE (each 2 mM) were applied 1 h before DKP-071 treatment was started. Cells which received only DKP-071 but no antagonist are indicated by (- - -). The antioxidative effect was also shown in HuT-78 and in HH by the use of VE/NAC. Mean values of triplicates +/− SD of a representative experiment are shown; for MyLa, three independent experiments, each one with triplicates, revealed highly comparable results. Examples of flow cytometry measurement are shown on the right side as overlays versus control. Statistical significance of the differences of DKP-071/NAC-treated cells as well as DKP-071/VE/NAC-treated cells is indicated, each compared to the cells that received only DKP-071 (** p < 0.01).
Figure 5
Figure 5
ROS suppression prevents apoptosis and restores cell viability. (a) Cell proliferation was determined at 24 h in response to DKP-071 as well as in response to the combination of NAC and VitE (2 mM; VE/NAC). Values were normalized to non-treated controls (100%). (b,c) Effects of agonists and antagonists on apoptosis induction (b) and cell viability (c), both at 48 h, are shown for MyLa cells. Examples of flow cytometry measurement are shown on the right side as overlays of treated cells versus controls. Mean values of triplicates +/− SD of representative experiments are shown; at least two independent experiments, each one with triplicates, revealed highly comparable results. Statistical significance of the differences between DKP-071/VE/NAC-treated cells to cells that received only DKP-071 is indicated (** p < 0.01).
Figure 6
Figure 6
Effects on MMP and caspase cascade. (a) Effects of antioxidative treatment (VE/NAC, 2 mM) as well as of QVD-Oph (QVD, 10 µM) on mitochondrial membrane potential (MMP) are shown for MyLa cells at 5 h of DKP-071 treatment. Cells, which received only DKP-071 but no antagonist are indicated by (- - -). Mean values of triplicates +/− SD of a representative experiment are shown; two independent experiments, each one with triplicates, revealed highly comparable results. Statistical significance of the differences between DKP-071/VE/NAC-treated cells to cells that received only DKP-071 is indicated (** p < 0.01). Examples of flow cytometry measurement are shown below as overlays versus control. The cell population with low MMP is indicated. (b) Effects of DKP-071 and antioxidative pre-treatment on the expression of characteristic regulatory proteins of the extrinsic apoptosis caspase cascade were investigated by Western blotting. Each 30 µg of protein was loaded per lane, and blots were probed with antibodies for extrinsic initiator caspase-8 (proform, 53/55 kDa), main effector caspase-3 (proform, 32 kDa; cleavage products, 23, 19, 17, 15 kDa), caspase-3 antagonist XIAP (51 kDa) and caspase-8 antagonist c-FLIP (FLIPL, long, 52 kDa; FLIPS, short, 25 kDa). The housekeeping protein glyceraldehyde 3-phosphate dehydrogenase (GAPDH, 37 kDa) was used as loading control. Three independent series of protein extracts and Western blotting experiments revealed highly comparable results. (c) The pathway suggested for indirubin DKP-071-mediated apoptosis. Arrows indicate activation; blunt end lines indicate inhibition.

Similar articles

Cited by

References

    1. Willemze R., Jaffe E.S., Burg G., Cerroni L., Berti E., Swerdlow S.H., Ralfkiaer E., Chimenti S., Diaz-Perez J.L., Duncan L.M., et al. WHO-EORTC classification for cutaneous lymphomas. Blood. 2005;105:3768–3785. doi: 10.1182/blood-2004-09-3502. - DOI - PubMed
    1. Jawed S.I., Myskowski P.L., Horwitz S., Moskowitz A., Querfeld C. Primary cutaneous T-cell lymphoma (mycosis fungoides and Sezary syndrome): Part II. Prognosis, management, and future directions. J. Am. Acad. Dermatol. 2014;70:223.e1–223.e17. doi: 10.1016/j.jaad.2013.07.049. - DOI - PubMed
    1. Eberle J., Kurbanov B.M., Hossini A.M., Trefzer U., Fecker L.F. Overcoming apoptosis deficiency of melanoma-hope for new therapeutic approaches. Drug Resist. Updates. 2007;10:218–234. doi: 10.1016/j.drup.2007.09.001. - DOI - PubMed
    1. Bladon J., Taylor P.C. Extracorporeal photopheresis induces apoptosis in the lymphocytes of cutaneous T-cell lymphoma and graft-versus-host disease patients. Br. J. Haematol. 1999;107:707–711. doi: 10.1046/j.1365-2141.1999.01773.x. - DOI - PubMed
    1. Krammer P.H., Arnold R., Lavrik I.N. Life and death in peripheral T cells. Nat. Rev. Immunol. 2007;7:532–542. doi: 10.1038/nri2115. - DOI - PubMed

MeSH terms