. 2019 Mar 7;11(3):330.
doi: 10.3390/cancers11030330.

CAFs and TGF-β Signaling Activation by Mast Cells Contribute to Resistance to Gemcitabine/Nabpaclitaxel in Pancreatic Cancer

Affiliations

CAFs and TGF-β Signaling Activation by Mast Cells Contribute to Resistance to Gemcitabine/Nabpaclitaxel in Pancreatic Cancer

Letizia Porcelli et al. Cancers (Basel). .

Abstract

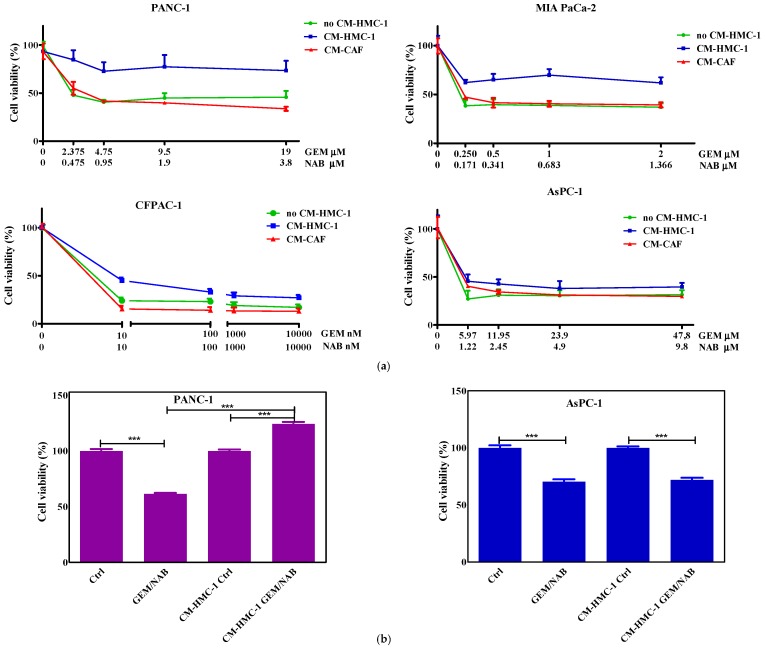
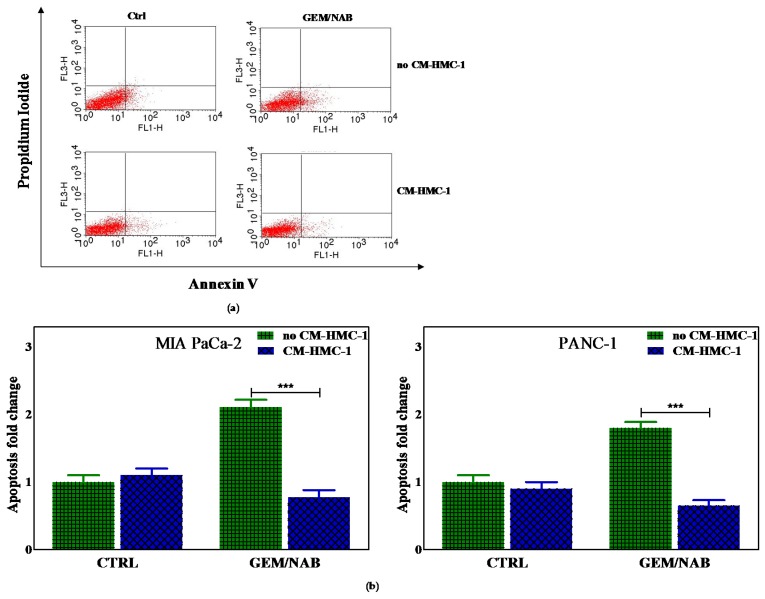
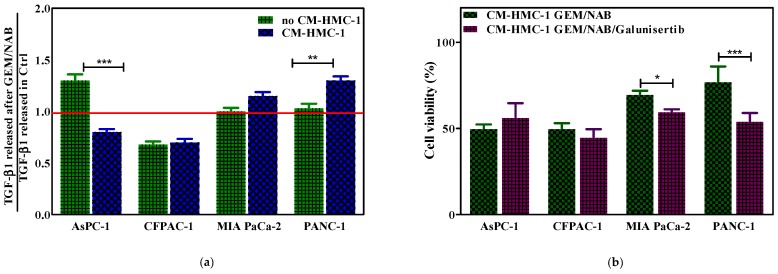
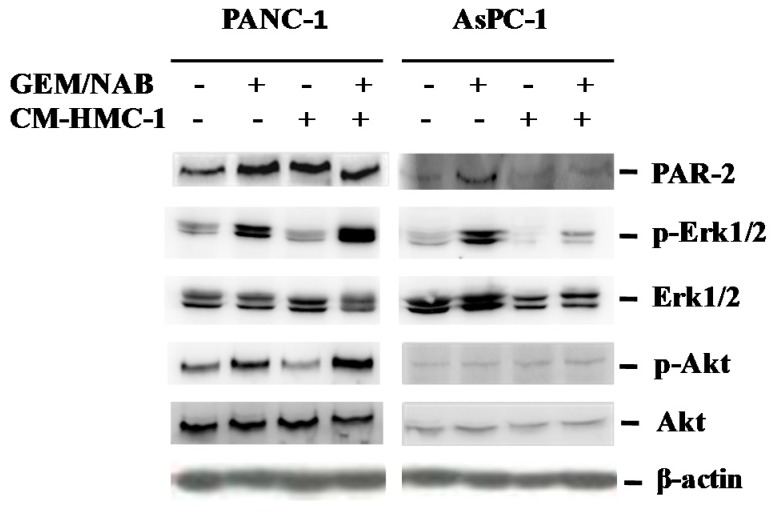
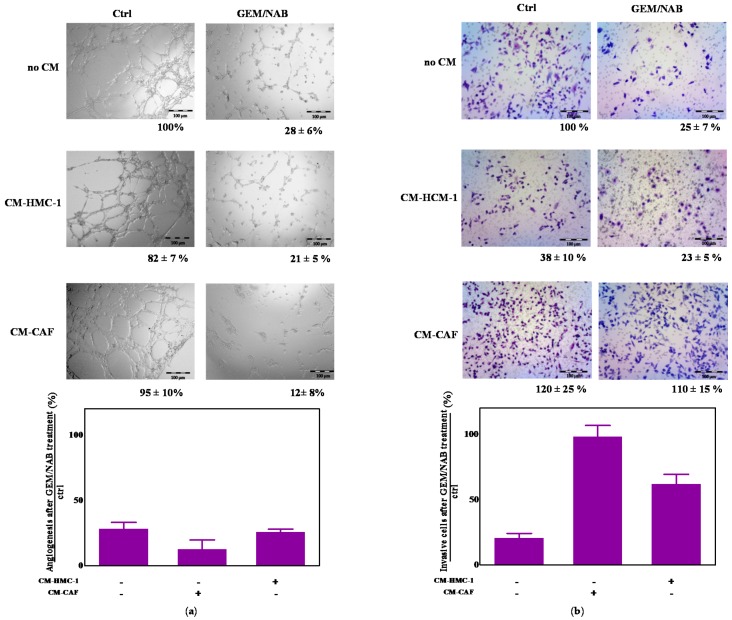
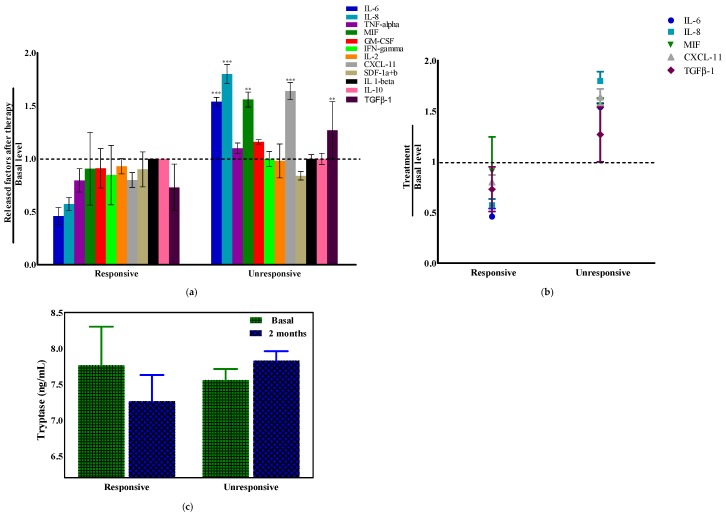
Tumor⁻stroma interactions are of key importance for pancreatic ductal adenocarcinoma (PDAC) progression. Our aim was to investigate whether cancer associated fibroblasts (CAFs) and mast cells (MC) affected the sensitivity of PDAC cells to gemcitabine/nabpaclitaxel (GEM/NAB). For this purpose, the combination cytotoxicity and the effect on tumor invasion and angiogenesis were evaluated with or without a conditioned medium from the mast cell line HMC-1 (human mast cell line-1 cells) and CAFs. Beside the clinical outcome of a homogenous population of PDAC patients, receiving GEM/NAB, was correlated to the circulating levels of mast cell tryptase and to a panel of inflammatory and immunosuppressive cytokines. CAFs neither affected drugs' cytotoxicity nor the inhibition of angiogenesis, but promoted tumor cell invasion. The MC instead, caused resistance to drugs by reducing apoptosis, by activating the TGF-β signalling and by promoting tumor invasion. Indeed, the inhibition of TβRI serine/threonine kinase activity by galunisertib restored drugs cytotoxicity. Moreover, MC induced the release of TGF-β1, and increased expression of PAR-2, ERK1/2 and Akt activation. Accordingly, TGF-β1, tryptase and other pro-inflammatory and immunosuppressive cytokines increased in the unresponsive patients. In conclusion, MC play a pivotal role in the resistance to GEM/NAB. A correlation between high level of circulating pro-inflammatory/ immunosuppressive cytokines and unresponsiveness was found in PDAC patients.

Keywords: CAFs; gemcitabine; mast cells; nabpaclitaxel; pancreatic cancer.


Conflict of interest statement

The authors declare no conflict of interest.

Figures

Figure 1
Figure 1
Dose response plots showing the inhibition of cell viability after treatment with GEM/NAB in the presence and absence of CM-HMC-1 or CM-CAF in 2D and 3D culture system. (a) PANC-1, MIA PaCa-2 and AsPC-1 cells were incubated with GEM/NAB at concentration: IC50/4, IC50/2, IC50, 2 × IC50, in the presence or absence of CM-HMC-1 and CM-CAFs. CFPAC-1 cells were incubated with GEM/NAB at concentration: IC50, IC50 × 10, IC50 × 100, IC50 × 1000, in the presence or absence of CM-HMC-1 and CM-CAFs. After 72 h, the survival of cells was determined and results are shown as dose-response plots. The results are the mean of three different experiments. (b) 3D cell culture of AsPC-1 and of PANC-1 were incubated with the combination at IC50s in the presence or absence of CM-HMC-1 for 72 h. Graph bars report cell viability percentage resulting from the mean of three different experiments (mean ± standard deviation (SD), *** p < 0.001).
Figure 2
Figure 2
The effect of CM-HCM-1 on drug combination-induced apoptosis by the annexin V method. PANC-1 and MIA PaCa-2 were treated with drug combination with or without CM-HMC-1. After 24 h, the combination induced annexin V staining of tested cells but the apoptosis was completely blocked by the presence of CM-HCM-1. What is shown are (a) dot plots from experiments performed on MIA PaCa-2 cells and (b) graph bars reporting apoptosis quantification in MIA PaCa-2 and PANC-1 (*** p < 0.001).
Figure 3
Figure 3
CM-HMC-1 induces the release of TGF-β1 and resistance to GEM/NAB. The release of TGF-β1 from cells was assessed after treatment(s). (a) Fold change of TGF-β1 release from GEM/NAB treated cells versus control sample, in presence and absence of CM-HMC-1 (*** p < 0.001). (b) Selective inhibition of TβRI by galunisertib restored the sensitivity to GEM/NAB in presence of CM-HMC-1. To assess whether TGF-β pathway drives resistance to GEM/NAB, the cell viability was assayed by adding 10 μM galunisertib to CM-HMC-1 + GEM/NAB (*** p < 0.001).
Figure 4
Figure 4
Signalling cascade activated in response to CM-HMC-1 in GEM/NAB treated and untreated cells. PAR-2 expression was increased by GEM/NAB in the responsive cells (AsPC-1) but not when CM-HMC-1 was added; instead in the resistant PANC-1 cells, both GEM/NAB and CM-HMC-1 increased PAR-2 expression. Accordingly, the activation of PAR-2 downstream effector Erk1/2 was found on AsPC-1 after GEM/NAB and on PANC-1 after GEM/NAB and CM-HMC-1, together with the activation of Akt.
Figure 5
Figure 5
CM-HMC-1 and CM-CAF did not alter GEM/NAB-dependent inhibition of tumor angiogenesis but reduced the efficacy on tumor invasion. (a) Capillary morphogenesis. Both CM-HMC-1 and CM-CAF did not alter angiogenesis as demonstrated by microvascular formation and did not reduce the antiangiogenic potential of GEM/NAB. Pictures represent three different experiments. (b) Invasion assay. Both CM-HMC-1 and CM-CAF altered tumor invasion, by inducing the decrese and the increase of MIA PaCa-2 invasion, respectively. Both conditioned media reduced the efficacy of GEM/NAB-dependent inhibion of tumor invasion as reported in the histogram plot showing the recovery of tumor invasion on CM-HMC-1/CM-CAF + GEM/NAB treated cells. The pictures represent three different experiments.
Figure 6
Figure 6
Tryptase and cytokines released in the blood of patients according to response to therapy. The analysis of some mediators released from tumor and stromal cells were measured in plasma or serum samples of 10 advanced pancreatic ductal adenocarcinoma (PDAC) patients. Venous blood was drawn before therapy (baseline) and after 2 months. (a) Graph bars report the fold change of cytokines in blood samples in responsive and unresponsive PDAC patients (b) the chart reports significantly different cytokine levels among the groups of patients. Statistical significance has been calculated using a two-way analysis of variance (ANOVA) followed by the Bonferroni post hoc tests (GraphPad Prism vers. 5). Data were indicated with ** p < 0.01, and *** p < 0.001. (c) Graph bars reports plasma levels of tryptase in PDAC patients.

Similar articles

Cited by

References

    1. Goldstein D., El-Maraghi R.H., Hammel P., Heinemann V., Kunzmann V., Sastre J., Scheithauer W., Siena S., Tabernero J., Teixeira L., et al. nab-Paclitaxel Plus Gemcitabine for Metastatic Pancreatic Cancer: Long-Term Survival From a Phase III Trial. JNCI J. Natl. Cancer Inst. 2015;107:dju413. doi: 10.1093/jnci/dju413. - DOI - PubMed
    1. Conroy T., Desseigne F., Ychou M., Bouché O., Guimbaud R., Bécouarn Y., Adenis A., Raoul J.-L., Gourgou-Bourgade S., de la Fouchardière C., et al. FOLFIRINOX versus Gemcitabine for Metastatic Pancreatic Cancer. N. Engl. J. Med. 2011;364:1817–1825. doi: 10.1056/NEJMoa1011923. - DOI - PubMed
    1. Von Hoff D.D., Ervin T., Arena F.P., Chiorean E.G., Infante J., Moore M., Seay T., Tjulandin S.A., Ma W.W., Saleh M.N., et al. Increased Survival in Pancreatic Cancer with nab-Paclitaxel plus Gemcitabine. N. Engl. J. Med. 2013;369:1691–1703. doi: 10.1056/NEJMoa1304369. - DOI - PMC - PubMed
    1. Nielsen M.F.B., Mortensen M.B., Detlefsen S. Key players in pancreatic cancer-stroma interaction: Cancer-associated fibroblasts, endothelial and inflammatory cells. World J. Gastroenterol. 2016;22:2678–2700. doi: 10.3748/wjg.v22.i9.2678. - DOI - PMC - PubMed
    1. Corbo V., Tortora G., Scarpa A. Molecular Pathology of Pancreatic Cancer: From Bench-to-Bedside Translation. Curr. Drug Targets. 2012;13:744–752. doi: 10.2174/138945012800564103. - DOI - PMC - PubMed