. 2019 Mar 12;20(1):208.
doi: 10.1186/s12864-019-5591-7.

Metagenomic analysis of microbe-mediated vitamin metabolism in the human gut microbiome

Affiliations

Metagenomic analysis of microbe-mediated vitamin metabolism in the human gut microbiome

Promi Das et al. BMC Genomics. .

Abstract

Background: Human gut microbial communities have been known to produce vitamins, which are subsequently absorbed by the host in the large intestine. However, the relationship between species with vitamin pathway associated functional features or their gene abundance in different states of health and disease is lacking. Here, we analyzed shotgun fecal metagenomes of individuals from four different countries for genes that are involved in vitamin biosynthetic pathways and transport mechanisms and corresponding species' abundance.

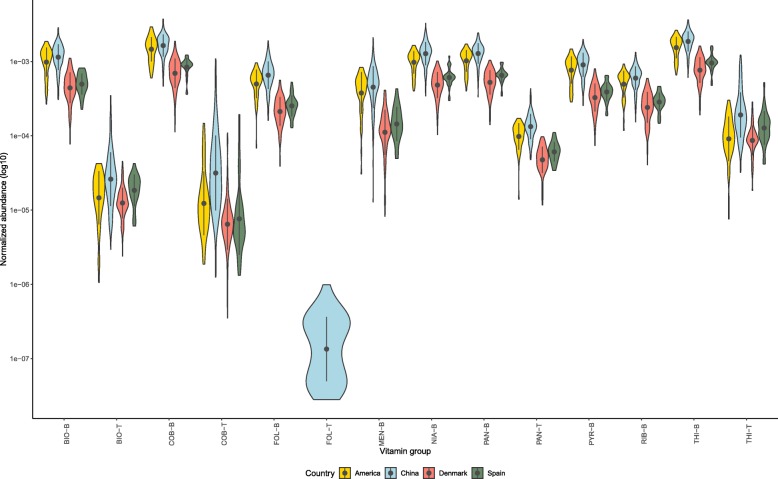
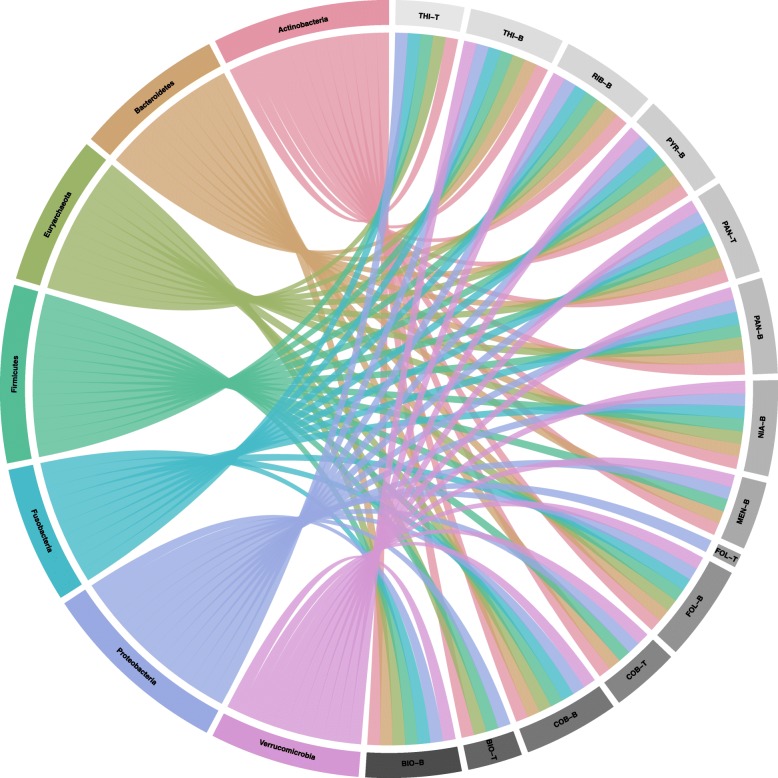
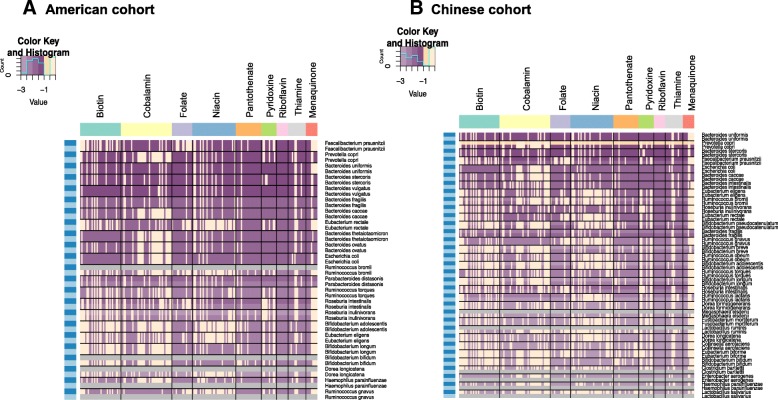
Results: We found that the prevalence of these genes were found to be distributed across the dominant phyla of gut species. The number of positive correlations were high between species harboring genes related to vitamin biosynthetic pathways and transporter mechanisms than that with either alone. Although, the range of total gene abundances remained constant across healthy populations at the global level, species composition and their presence for metabolic pathway related genes determine the abundance and functional genetic content of vitamin metabolism. Based on metatranscriptomics data, the equation between abundance of vitamin-biosynthetic enzymes and vitamin-dependent enzymes suggests that the production and utilization potential of these enzymes seems way more complex usage allocations than just mere direct linear associations.

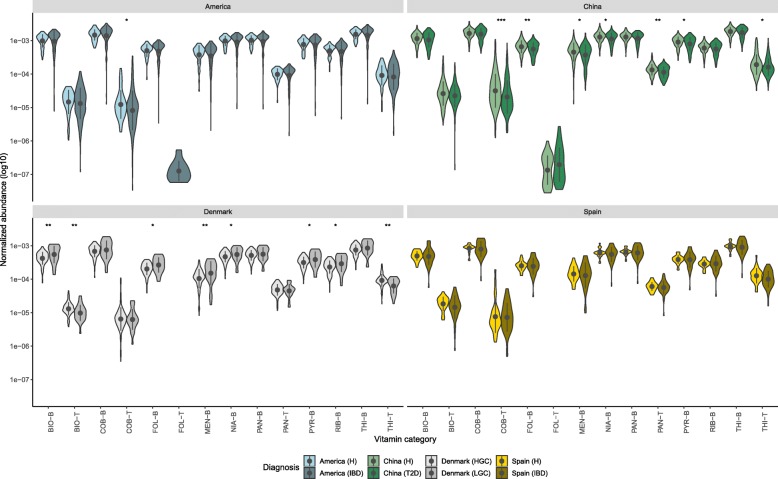
Conclusions: Our findings provide a rationale to examine and disentangle the interrelationship between B-vitamin dosage (dietary or microbe-mediated) on gut microbial members and the host, in the gut microbiota of individuals with under- or overnutrition.

Keywords: B-vitamins; Gut metabolism; Metagenomics; Metatranscriptomics; Vitamin consumers; Vitamin prototrophs.


Conflict of interest statement

Ethics approval and consent to participate

Not applicable.

Consent for publication

Not applicable.

Competing interests

The authors declare that they have no competing interests.

Publisher’s Note

Springer Nature remains neutral with regard to jurisdictional claims in published maps and institutional affiliations.

Figures

Fig. 1
Fig. 1
Violin plot showing total normalized abundance of genes in healthy fecal samples from four different countries (i.e. USA, China, Denmark, Spain). Microbial genes annotated to KOs were grouped into the respective type of B and K2 vitamins. The pointrange refers to the mean and standard deviation. The shape represents the kernel probability density of the data across different vitamin types are abbreviated as: biotin (BIO), cobalamin (COB), folate (FOL), menaquinone (MEN), niacin (NIA), pantothenate (PAN), pyridoxine (PYR), riboflavin (RIB), thiamine (THI). Suffixes that end with -B and -T are related to biosynthetic and transporter related genes respectively. [For detailed statistical results, the reader is referred to the Additional file 1: Table S11, where the asterisks indicate ns: p > 0.05, *: p < = 0.05, **: p < = 0.01, ***: p < = 0.001, ****: p < = 0.0001 (Mann-Whitney Wilcoxon test)]
Fig. 2
Fig. 2
Violin plot showing total normalized abundance of genes in fecal samples from four different countries (i.e. USA, China, Denmark, Spain) under different states of health and disease. Microbial genes annotated to KOs were grouped into the respective type of B and K2 vitamins. The pointrange refers to the mean and standard deviation. The shape represents the kernel probability density of the data across different vitamin types are abbreviated as: biotin (BIO), cobalamin (COB), folate (FOL), menaquinone (MEN), niacin (NIA), pantothenate (PAN), pyridoxine (PYR), riboflavin (RIB), thiamine (THI). Suffixes that end with -B and -T are related to biosynthetic and transporter related genes respectively. The asterisks on the top indicate ns: p > 0.05, *: p < = 0.05, **: p < = 0.01, ***: p < = 0.001, ****: p < = 0.0001 (Mann-Whitney Wilcoxon test)
Fig. 3
Fig. 3
Circular plot with links representing the prevalence of vitamin metabolism among different phyla of human gut microbiota. Each phylum is colored and each type of vitamin phenotype is shown in grey. The vitamin types are abbreviated as: biotin (BIO), cobalamin (COB), folate (FOL), menaquinone (MEN), niacin (NIA), pantothenate (PAN), pyridoxine (PYR), riboflavin (RIB), thiamine (THI). Suffixes that end with -B and -T are related to biosynthetic and transporter related genes respectively
Fig. 4
Fig. 4
Heatmap showing relative gene abundance of reactions associated with gene annotations of vitamin biosynthetic pathways in genome-scale metabolic models (GEMs) based on species abundance of abundant gut bacteria (a) American cohort and (b) Chinese cohort. The x-axis represents the reaction IDs associated to each vitamin pathway and on the y-axis the list of abundant gut bacteria are shown. Light blue and dark blue (on the left) represents healthy and diseased of associated reaction abundance to each microbial species (on the right) respectively. Grey color in every row represents absence of species in the cohort and the purple color key (dark to light color) represents abundance from high to low values
Fig. 5
Fig. 5
Violin plot showing mean relative abundance of (a) vitamin-biosynthetic genes and (b) vitamin-dependent genes in fecal samples from American cohort. Microbial genes annotated to EC numbers were grouped into the respective type of B and K2 vitamins. The pointrange refers to the mean and standard deviation. The shape represents the kernel probability density of the data across different vitamin types are abbreviated as: biotin (BIO), cobalamin (COB), folate (FOL), menaquinone (MEN), niacin (NIA), pantothenate (PAN), pyridoxine (PYR), riboflavin (RIB), thiamine (THI). Suffixes that end with -B are biosynthetic related enzymes. The asterisks on the top indicate ns: p > 0.05, *: p < = 0.05, **: p < = 0.01, ***: p < = 0.001, ****: p < = 0.0001 (Mann-Whitney Wilcoxon test)

Similar articles

Cited by

References

    1. Said HM, Kumar C. Intestinal absorption of vitamins. Curr Opin Gastroenterol. 1999;15:172–176. doi: 10.1097/00001574-199903000-00015. - DOI - PubMed
    1. Said HM, Mohammed ZM. Intestinal absorption of water-soluble vitamins: an update. Curr Opin Gastroenterol. 2006;22:140–146. doi: 10.1097/01.mog.0000203870.22706.52. - DOI - PubMed
    1. Said HM, Nexo E. Gastrointestinal Handling of Water-Soluble Vitamins. Compr Physiol. 2018;8:1291–1311. doi: 10.1002/cphy.c170054. - DOI - PubMed
    1. Rossi M, Amaretti A, Raimondi S. Folate production by probiotic bacteria. Nutrients. 2011;3:118–134. doi: 10.3390/nu3010118. - DOI - PMC - PubMed
    1. Degnan PH, Taga ME, Goodman AL. Vitamin B12 as a modulator of gut microbial ecology. Cell Metab. 2014;20:769–778. doi: 10.1016/j.cmet.2014.10.002. - DOI - PMC - PubMed

LinkOut - more resources