

Relationships between orthostatic hypotension, frailty, falling and mortality in elderly care home residents
- PMID: 30866845
- PMCID: PMC6415493
- DOI: 10.1186/s12877-019-1082-6
Relationships between orthostatic hypotension, frailty, falling and mortality in elderly care home residents
Abstract
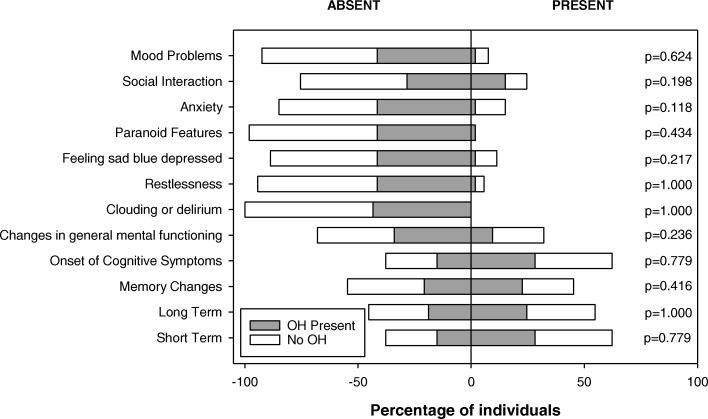
Background: Orthostatic hypotension (OH; profound falls in blood pressure when upright) is a common deficit that increases in incidence with age, and may be associated with falling risk. Deficit accumulation results in frailty, regarded as enhanced vulnerability to adverse outcomes. We aimed to evaluate the relationships between OH, frailty, falling and mortality in elderly care home residents.
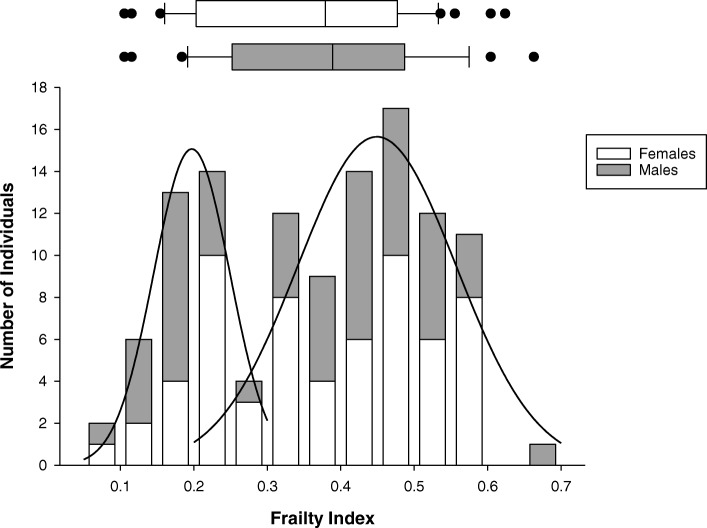
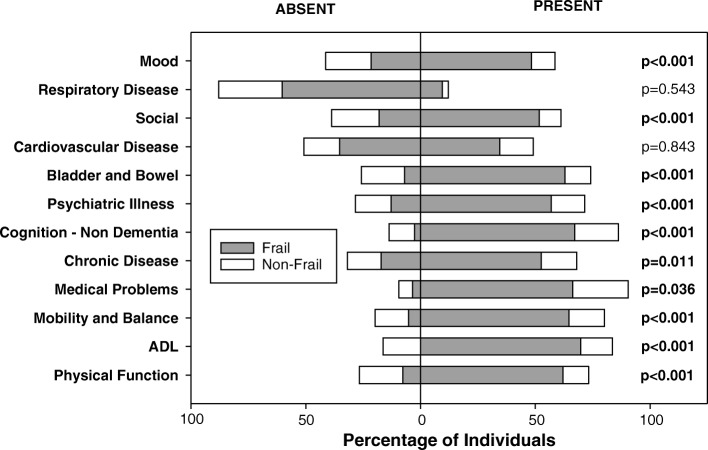
Methods: From the Minimum Data Set (MDS) document, a frailty index (FI-MDS) was generated from a list of 58 deficits, ranging from 0 (no deficits) to 1.0 (58 deficits). OH was evaluated from beat-to-beat blood pressure and heart rate (finger plethysmography) collected during a 15-min supine-seated orthostatic stress test. Retrospective and prospective falling rates (falls/year) were extracted from facility falls incident reports. All-cause 3-year mortality was determined. Data are reported as mean ± standard error.
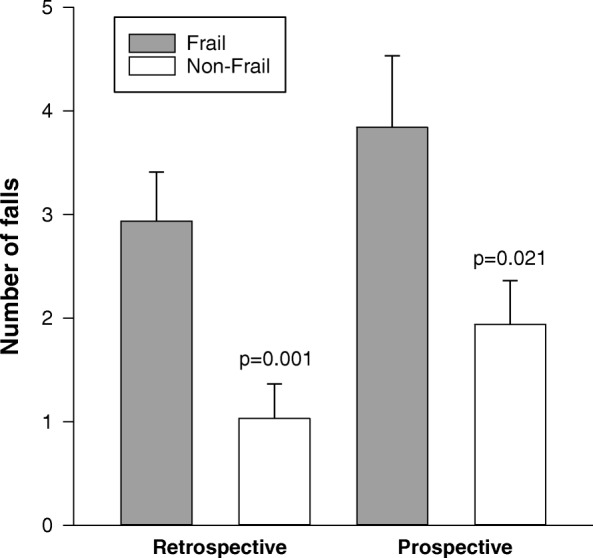
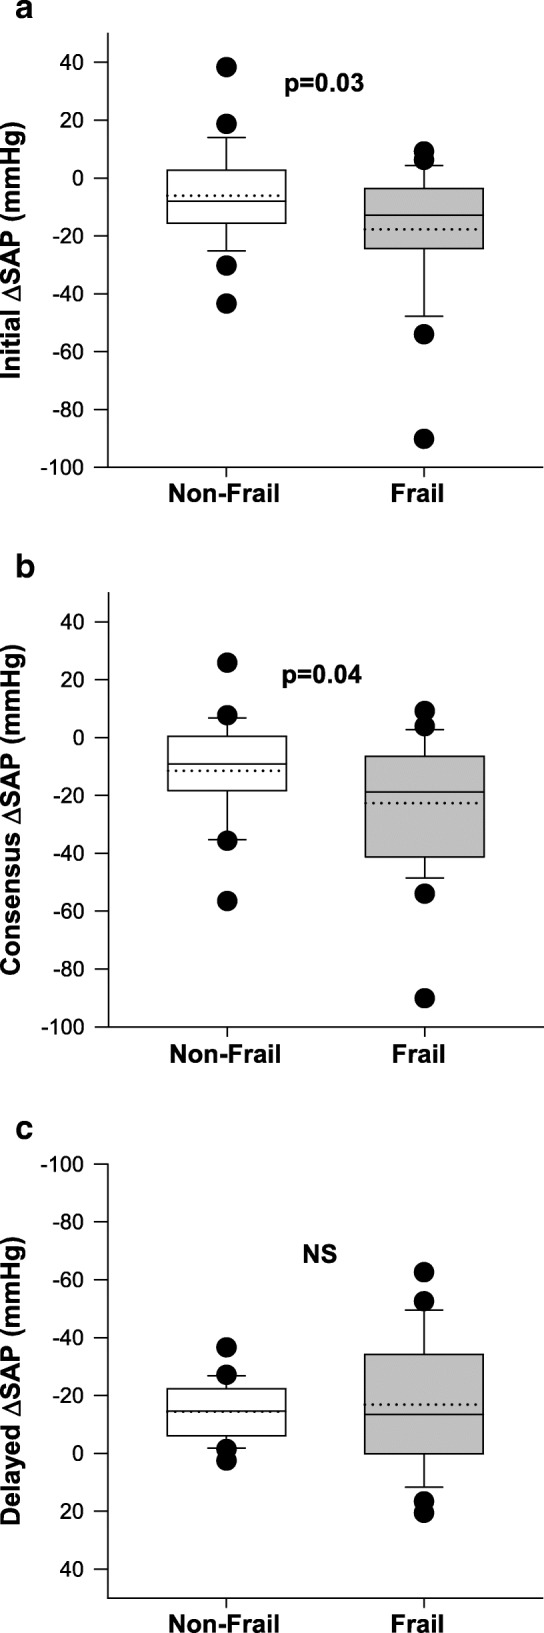
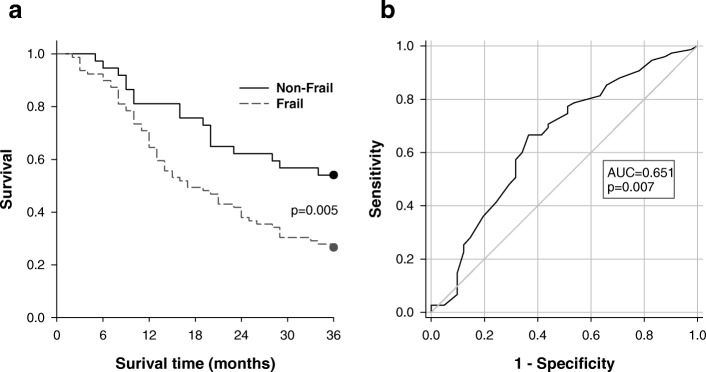
Results: Data were obtained from 116 older adults (aged 84.2 ± 0.9 years; 44% males) living in two long term care facilities. The mean FI-MDS was 0.36 ± 0.01; FI-MDS was correlated with age (r = 0.277; p = 0.003). Those who were frail (FI ≥ 0.27) had larger Initial (- 17.8 ± 4.2 vs - 6.1 ± 3.3 mmHg, p = 0.03) and Consensus (- 22.7 ± 4.3 vs - 11.5 ± 3.3 mmHg, p = 0.04) orthostatic reductions in systolic arterial pressure. Frail individuals had higher prospective and retrospective falling rates and higher 3-year mortality. Receiver operating characteristic curves evaluated the ability of FI-MDS alone to predict prospective falls (sensitivity 72%, specificity 36%), Consensus OH (sensitivity 68%, specificity 60%) and 3-year mortality (sensitivity 77%, specificity 49%). Kaplan Meier survival analyses showed significantly higher 3-year mortality in those who were frail compared to the non-frail (p = 0.005).
Conclusions: Frailty can be captured using a frailty index based on MDS data in elderly individuals living in long term care, and is related to susceptibility to orthostatic hypotension, falling risk and 3-year mortality. Use of the MDS to generate a frailty index may represent a simple and convenient risk assessment tool for older adults living in long term care. Older adults who are both frail and have impaired orthostatic blood pressure control have a particularly high risk of falling and should receive tailored management to mitigate this risk.
Keywords: Falling; Frailty; Older adults; Orthostatic hypotension.
Conflict of interest statement
Ethics approval and consent to participate
This study received ethical approval from the Department of Research Ethics at Simon Fraser University and conforms to the principles outlined in the Declaration of Helsinki. Written informed consent was obtained prior to participation from the participants or their legal designate (with verbal assent). Participants were recruited from two long-term care facilities in British Columbia (Delta View and New Vista Society) and were eligible to participate if they had resided in the facility for at least two years, were aged ≥65 years, and it was possible to obtain access to their MDS.
Consent for publication
Not applicable.
Competing interests
The authors declare that they have no competing interests.
Publisher’s Note
Springer Nature remains neutral with regard to jurisdictional claims in published maps and institutional affiliations.
Figures
Similar articles
-
Cardiovascular responses to orthostasis and their association with falls in older adults.BMC Geriatr. 2015 Dec 24;15:174. doi: 10.1186/s12877-015-0168-z. BMC Geriatr. 2015. PMID: 26703012 Free PMC article.
-
Orthostatic hypotension (OH) and mortality in relation to age, blood pressure and frailty.Arch Gerontol Geriatr. 2012 May-Jun;54(3):e255-60. doi: 10.1016/j.archger.2011.12.009. Epub 2012 Jan 10. Arch Gerontol Geriatr. 2012. PMID: 22240412
-
Cardiovascular regulation during active standing orthostatic stress in older adults living with frailty: a systematic review.Arch Gerontol Geriatr. 2025 Sep;136:105894. doi: 10.1016/j.archger.2025.105894. Epub 2025 May 16. Arch Gerontol Geriatr. 2025. PMID: 40411932
-
The degree and timing of orthostatic blood pressure changes in relation to falls in nursing home residents.J Am Med Dir Assoc. 2004 Jul-Aug;5(4):233-8. doi: 10.1097/01.JAM.0000129837.51514.93. J Am Med Dir Assoc. 2004. PMID: 15228632
-
The relationship between orthostatic hypotension and falling in older adults.Clin Auton Res. 2014 Feb;24(1):3-13. doi: 10.1007/s10286-013-0219-5. Epub 2013 Nov 20. Clin Auton Res. 2014. PMID: 24253897 Review.
Cited by
-
[Dizziness in old age].Z Gerontol Geriatr. 2025 Feb;58(1):55-63. doi: 10.1007/s00391-024-02404-2. Epub 2025 Jan 23. Z Gerontol Geriatr. 2025. PMID: 39847083 Review. German.
-
Admissions for orthostatic hypotension: an analysis of NHS England Hospital Episode Statistics data.BMJ Open. 2019 Nov 26;9(11):e034087. doi: 10.1136/bmjopen-2019-034087. BMJ Open. 2019. PMID: 31772114 Free PMC article.
-
Prevalence of initial orthostatic hypotension in older adults: a systematic review and meta-analysis.Age Ageing. 2021 Sep 11;50(5):1520-1528. doi: 10.1093/ageing/afab090. Age Ageing. 2021. PMID: 34260686 Free PMC article.
-
Prevalence and Risk Factors of Postprandial Hypotension among Elderly People Admitted in a Geriatric Evaluation and Management Unit : An Observational Study.J Nutr Health Aging. 2019;23(10):1026-1033. doi: 10.1007/s12603-019-1271-1. J Nutr Health Aging. 2019. PMID: 31781734 Free PMC article.
-
Amlodipine and frusemide: pharmacological factors contributing to increased fall risk in concurrently treated patients - a retrospective cross-sectional study.Front Pharmacol. 2025 Jul 28;16:1598161. doi: 10.3389/fphar.2025.1598161. eCollection 2025. Front Pharmacol. 2025. PMID: 40792214 Free PMC article.
References
-
- Rockwood K, Mitnitski A. Frailty in relation to the accumulation of deficits. J Gerontol - Ser A Biol Sci Med Sci. 2007;62(7):722–727. - PubMed
-
- Fried LP, Ferrucci L, Darer J, Williamson JD, Anderson G. Untangling the concepts of disability, frailty, and comorbidity: implications for improved targeting and care. J Gerontol Ser A Biol Sci Med Sci [Internet] 2004;59(3):M255–M263. - PubMed
-
- Gobbens RJ, Luijkx KG, Wijnen-Sponselee MT, Schols JM. Toward a conceptual definition of frail community dwelling older people. Nurs Outlook [Internet] 2010;58(2):76–86. - PubMed
Publication types
MeSH terms
Grants and funding
LinkOut - more resources
Full Text Sources
Medical
Research Materials
Miscellaneous
